
Bequant lets you measure the quality you deliver to your network users and monitor both your network equipment and the performance of applications.
Resolve support calls faster

Reduce support calls and truck rolls

Intelligence about your network
The DPI and network visibility from Bequant allow us to see what is happening in our network in real-time. Our customer support can diagnose everyday problems with it, and it also helps us detecting those areas of the network where we are approaching congestion.
Real-time DPI
Diagnose network issues in real-time with Deep-Packet Inspection (DPI).
With DPI, you can see which applications are running in your network. Paired with real-time metrics, it enables you to diagnose customer issues that would otherwise require a truck roll — since many problems stem from specific applications.


600+ ISPs powered by Bequant


Detect congested equipment
Heatmaps reveal the busiest network equipment.
Easily compare access points, OLT ports, and other equipment to spot congestion and keep the network running smoothly.
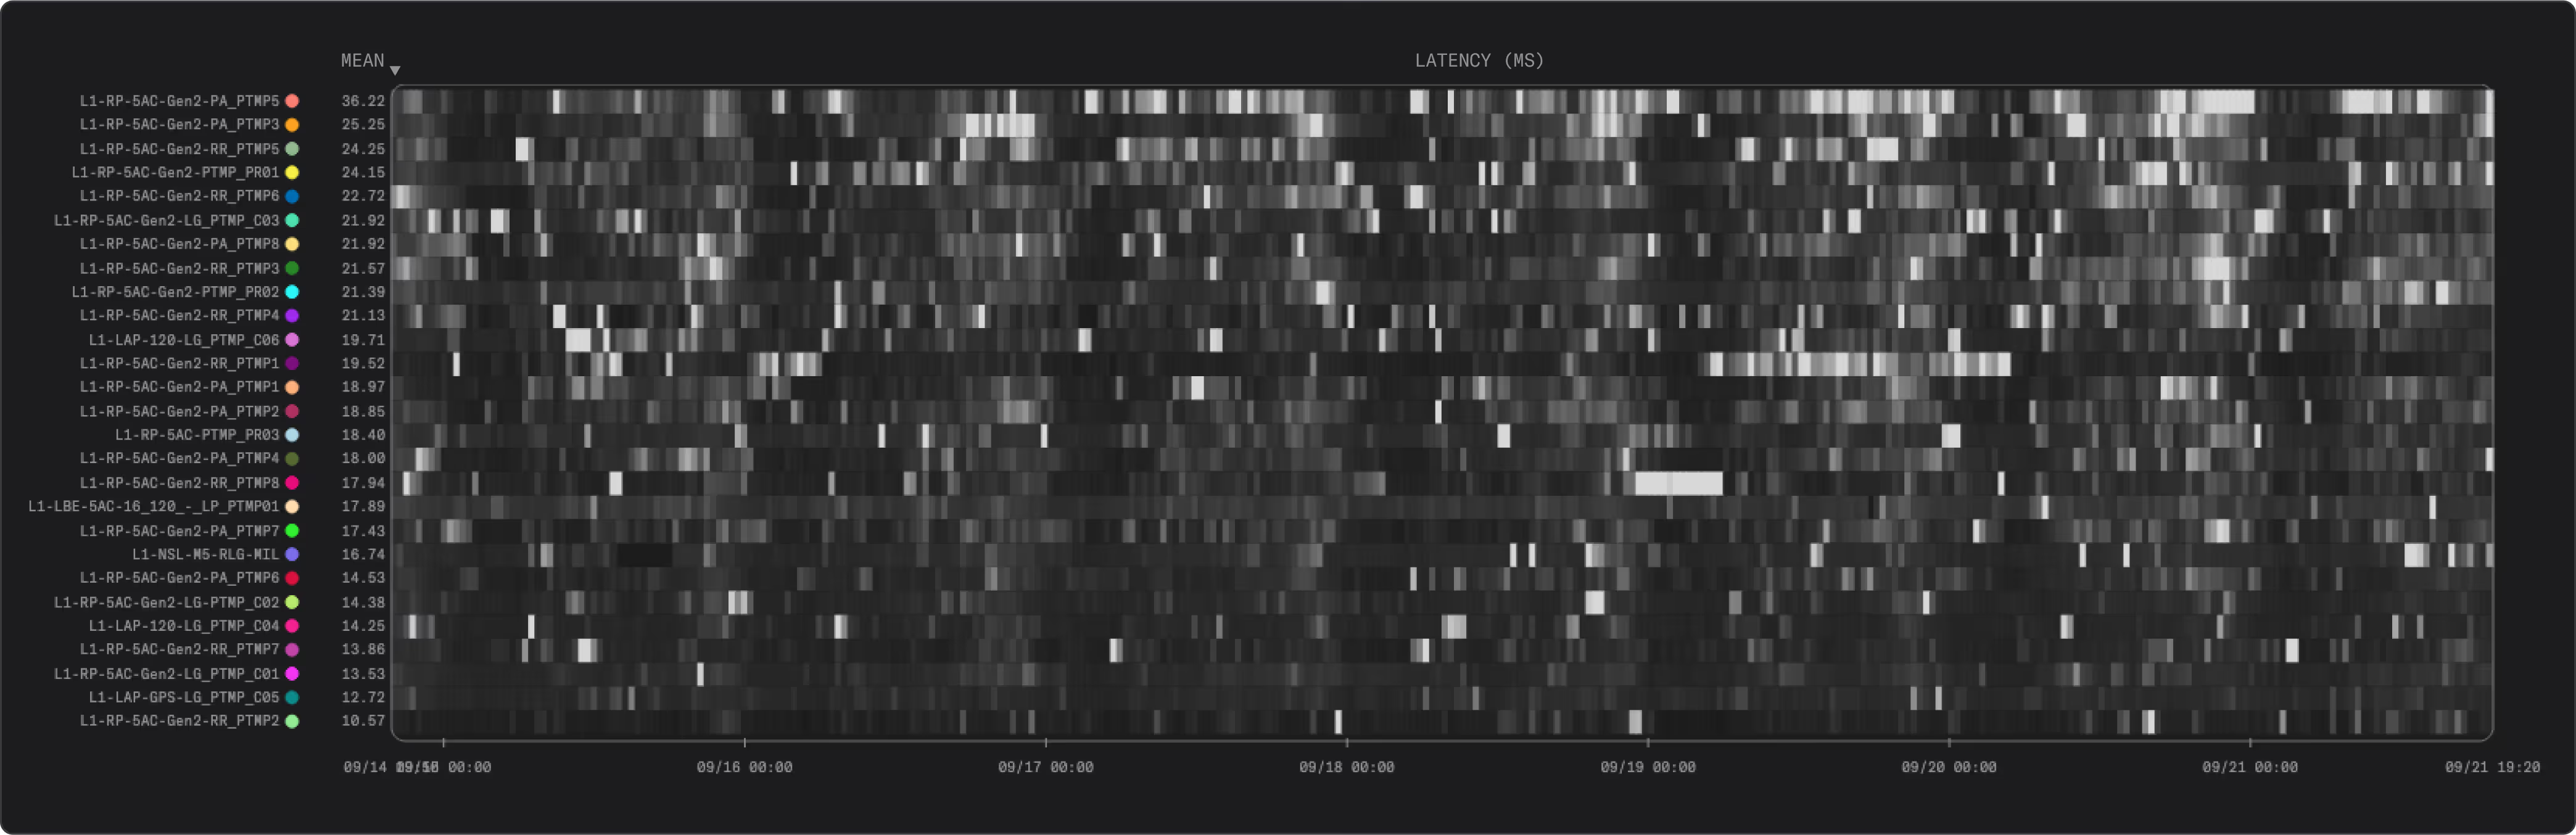
With scatter-plots, it becomes possible to identify whether congestion is caused by a network device operating at too high a speed.
For example, in the chart for an access point, congestion appears once it goes beyond 50 Mbps. This situation can be improved by using Bequant to enforce a maximum throughput for the device, in this case applying a 50 Mbps limit.
Monitor user network quality
Measure Quality of Experience in your network.
We provide metrics to monitor the overall Quality of Experience delivered by your network to your customers, as well as detailed historical information about each subscriber to let you diagnose problems.
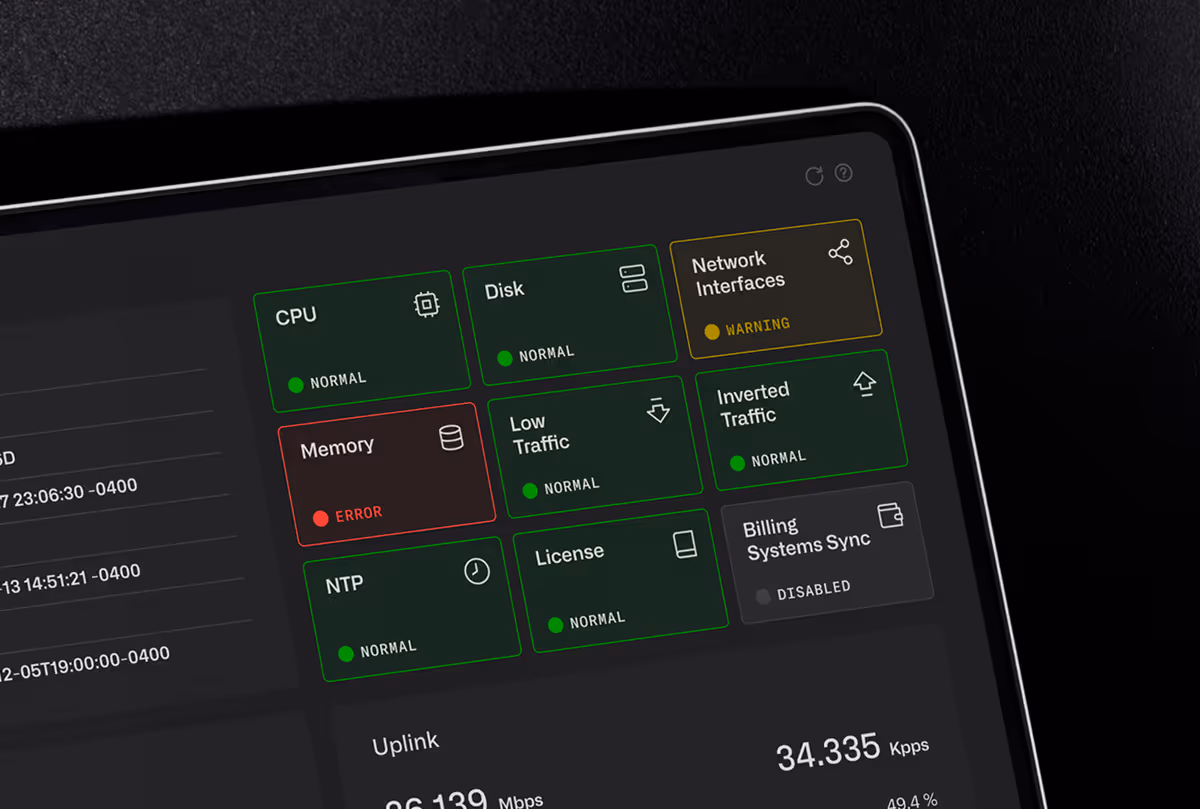
Monitor key network quality metrics
The BQN platform monitors 5 key metrics to measure the Quality of Experience of all the subscribers in your network in real-time. It shows the distribution of those key metrics, with configurable warning thresholds, so that you can easily see your network status.
The key metrics include the maximum speed attained during the last 24 hours, the latency, the percentage of packet retransmissions (i.e. losses), the percentage of traffic suffering congestion (which we obtained with an advanced learning algorithm), and the percentage of traffic transmitted at maximum speed.
Lorem Ipsum is simply dummy text of the printing and typesetting industry.


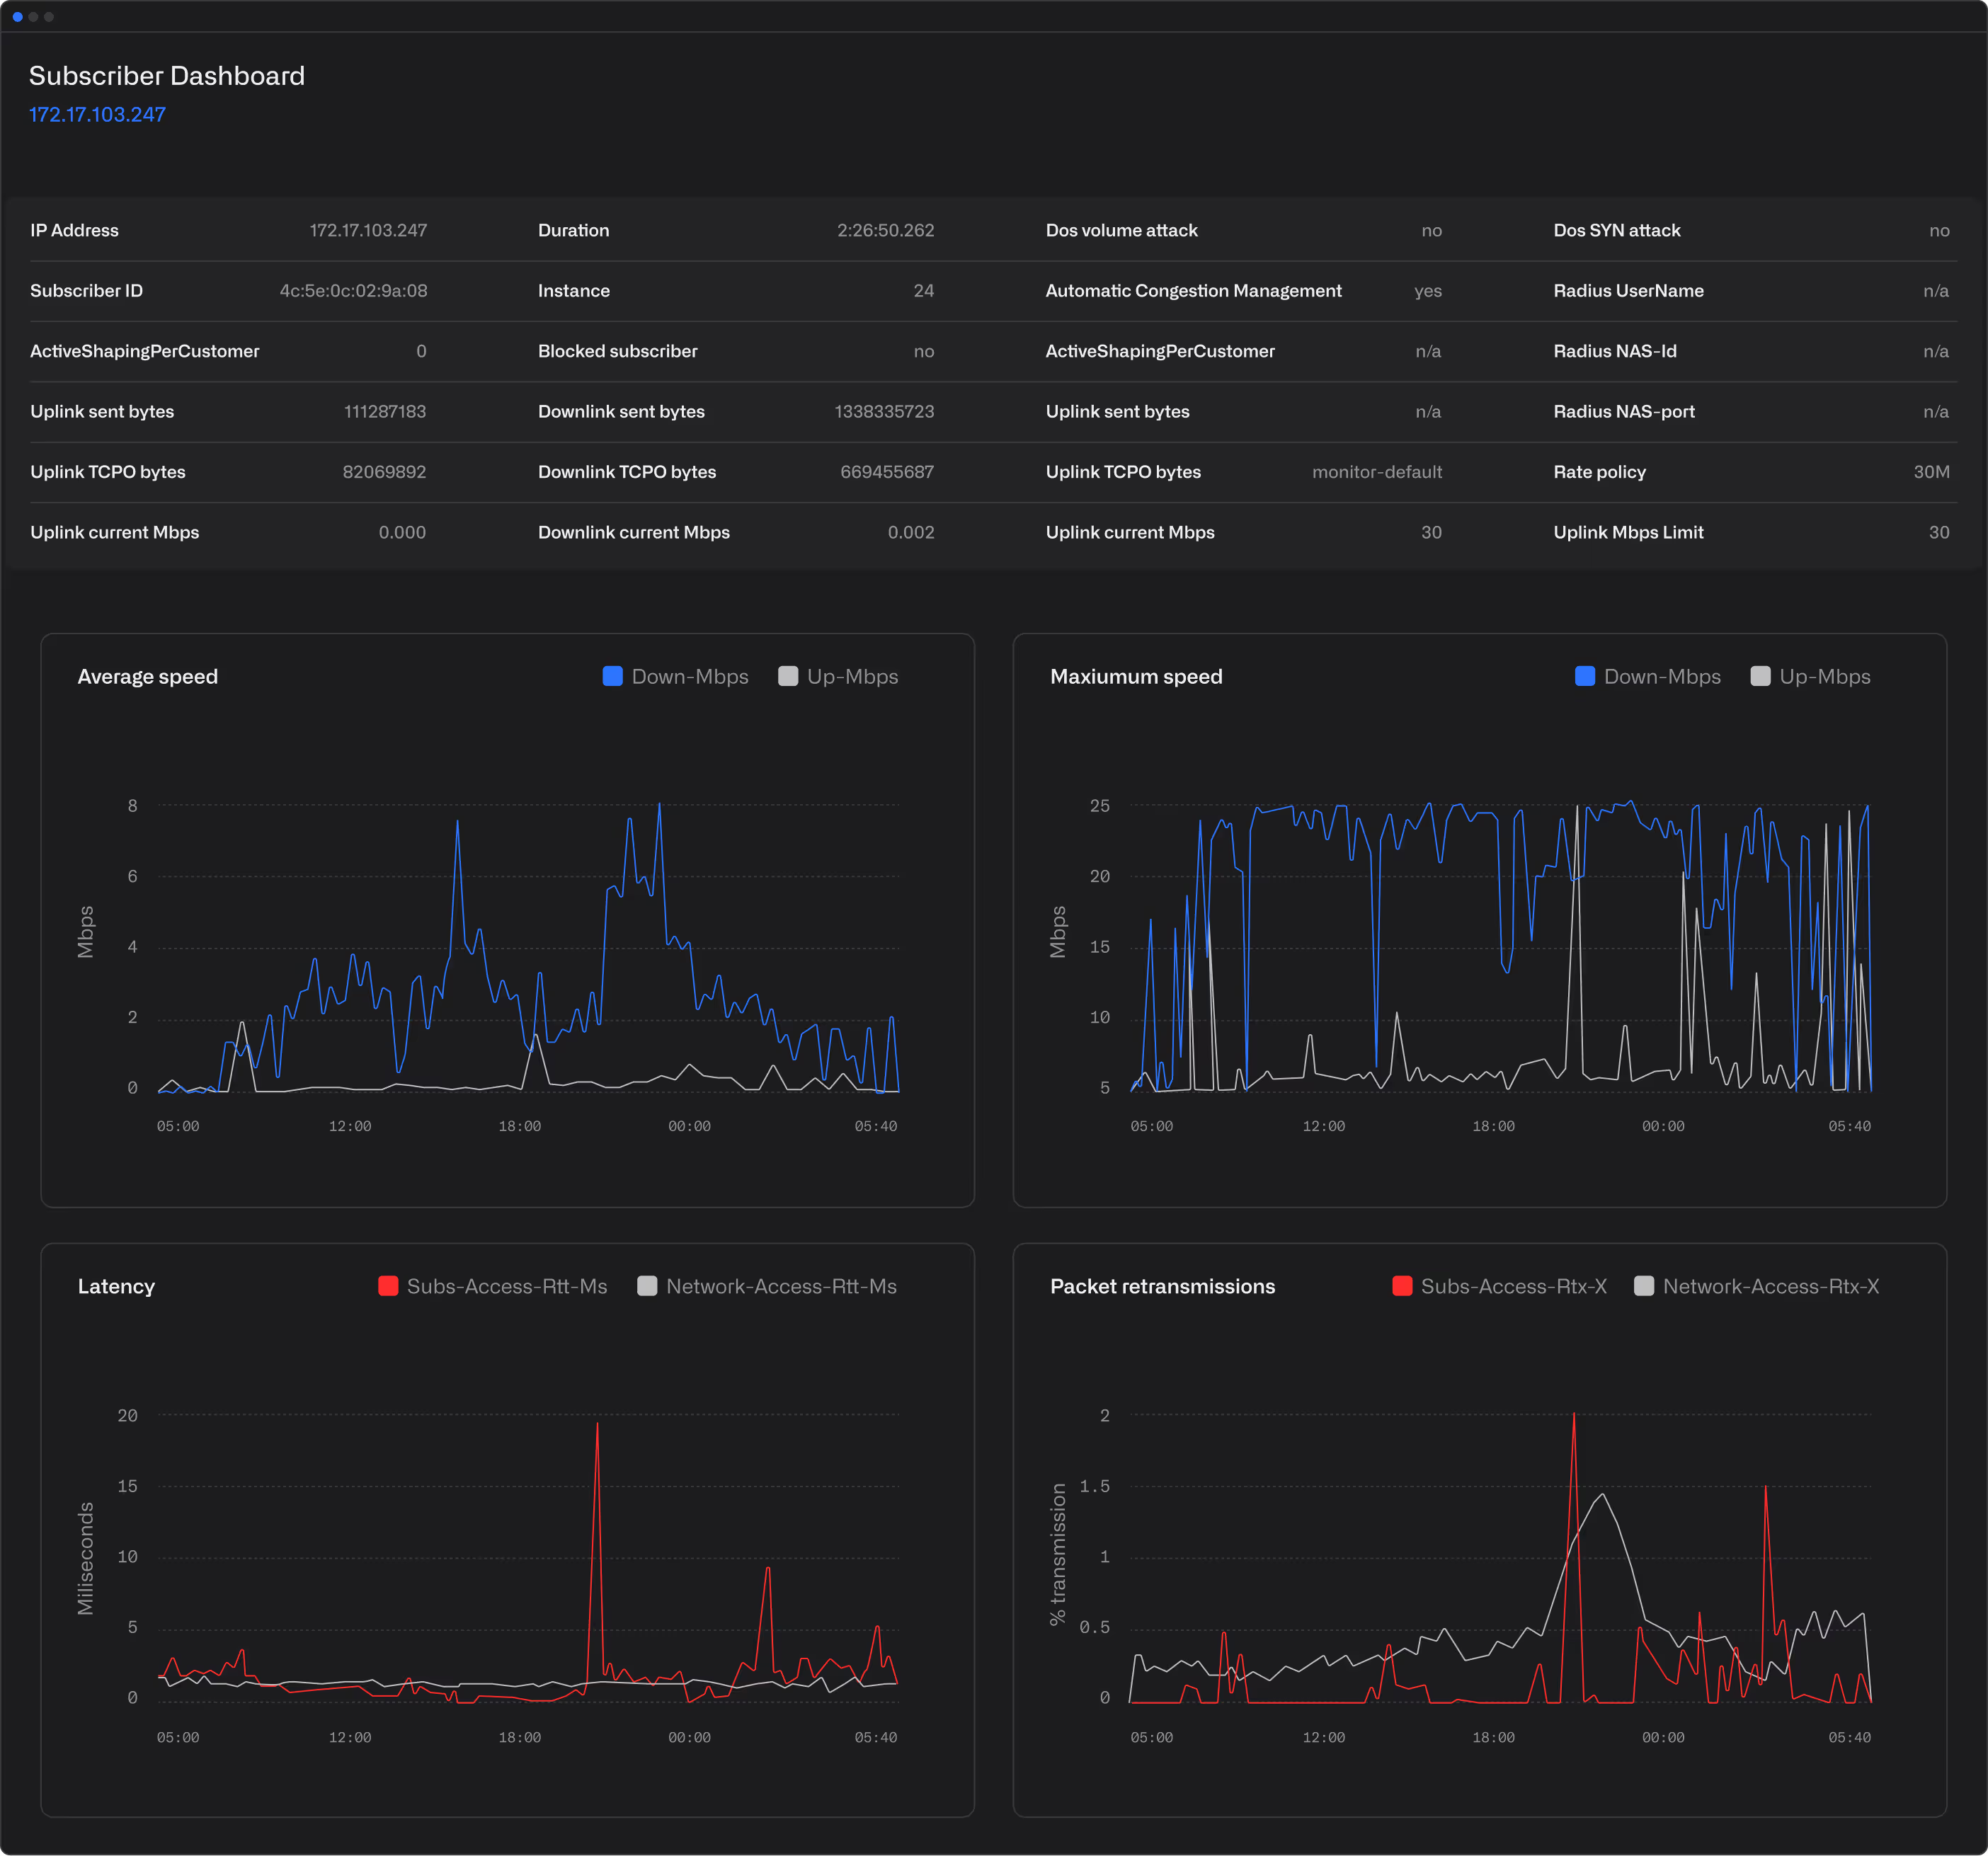
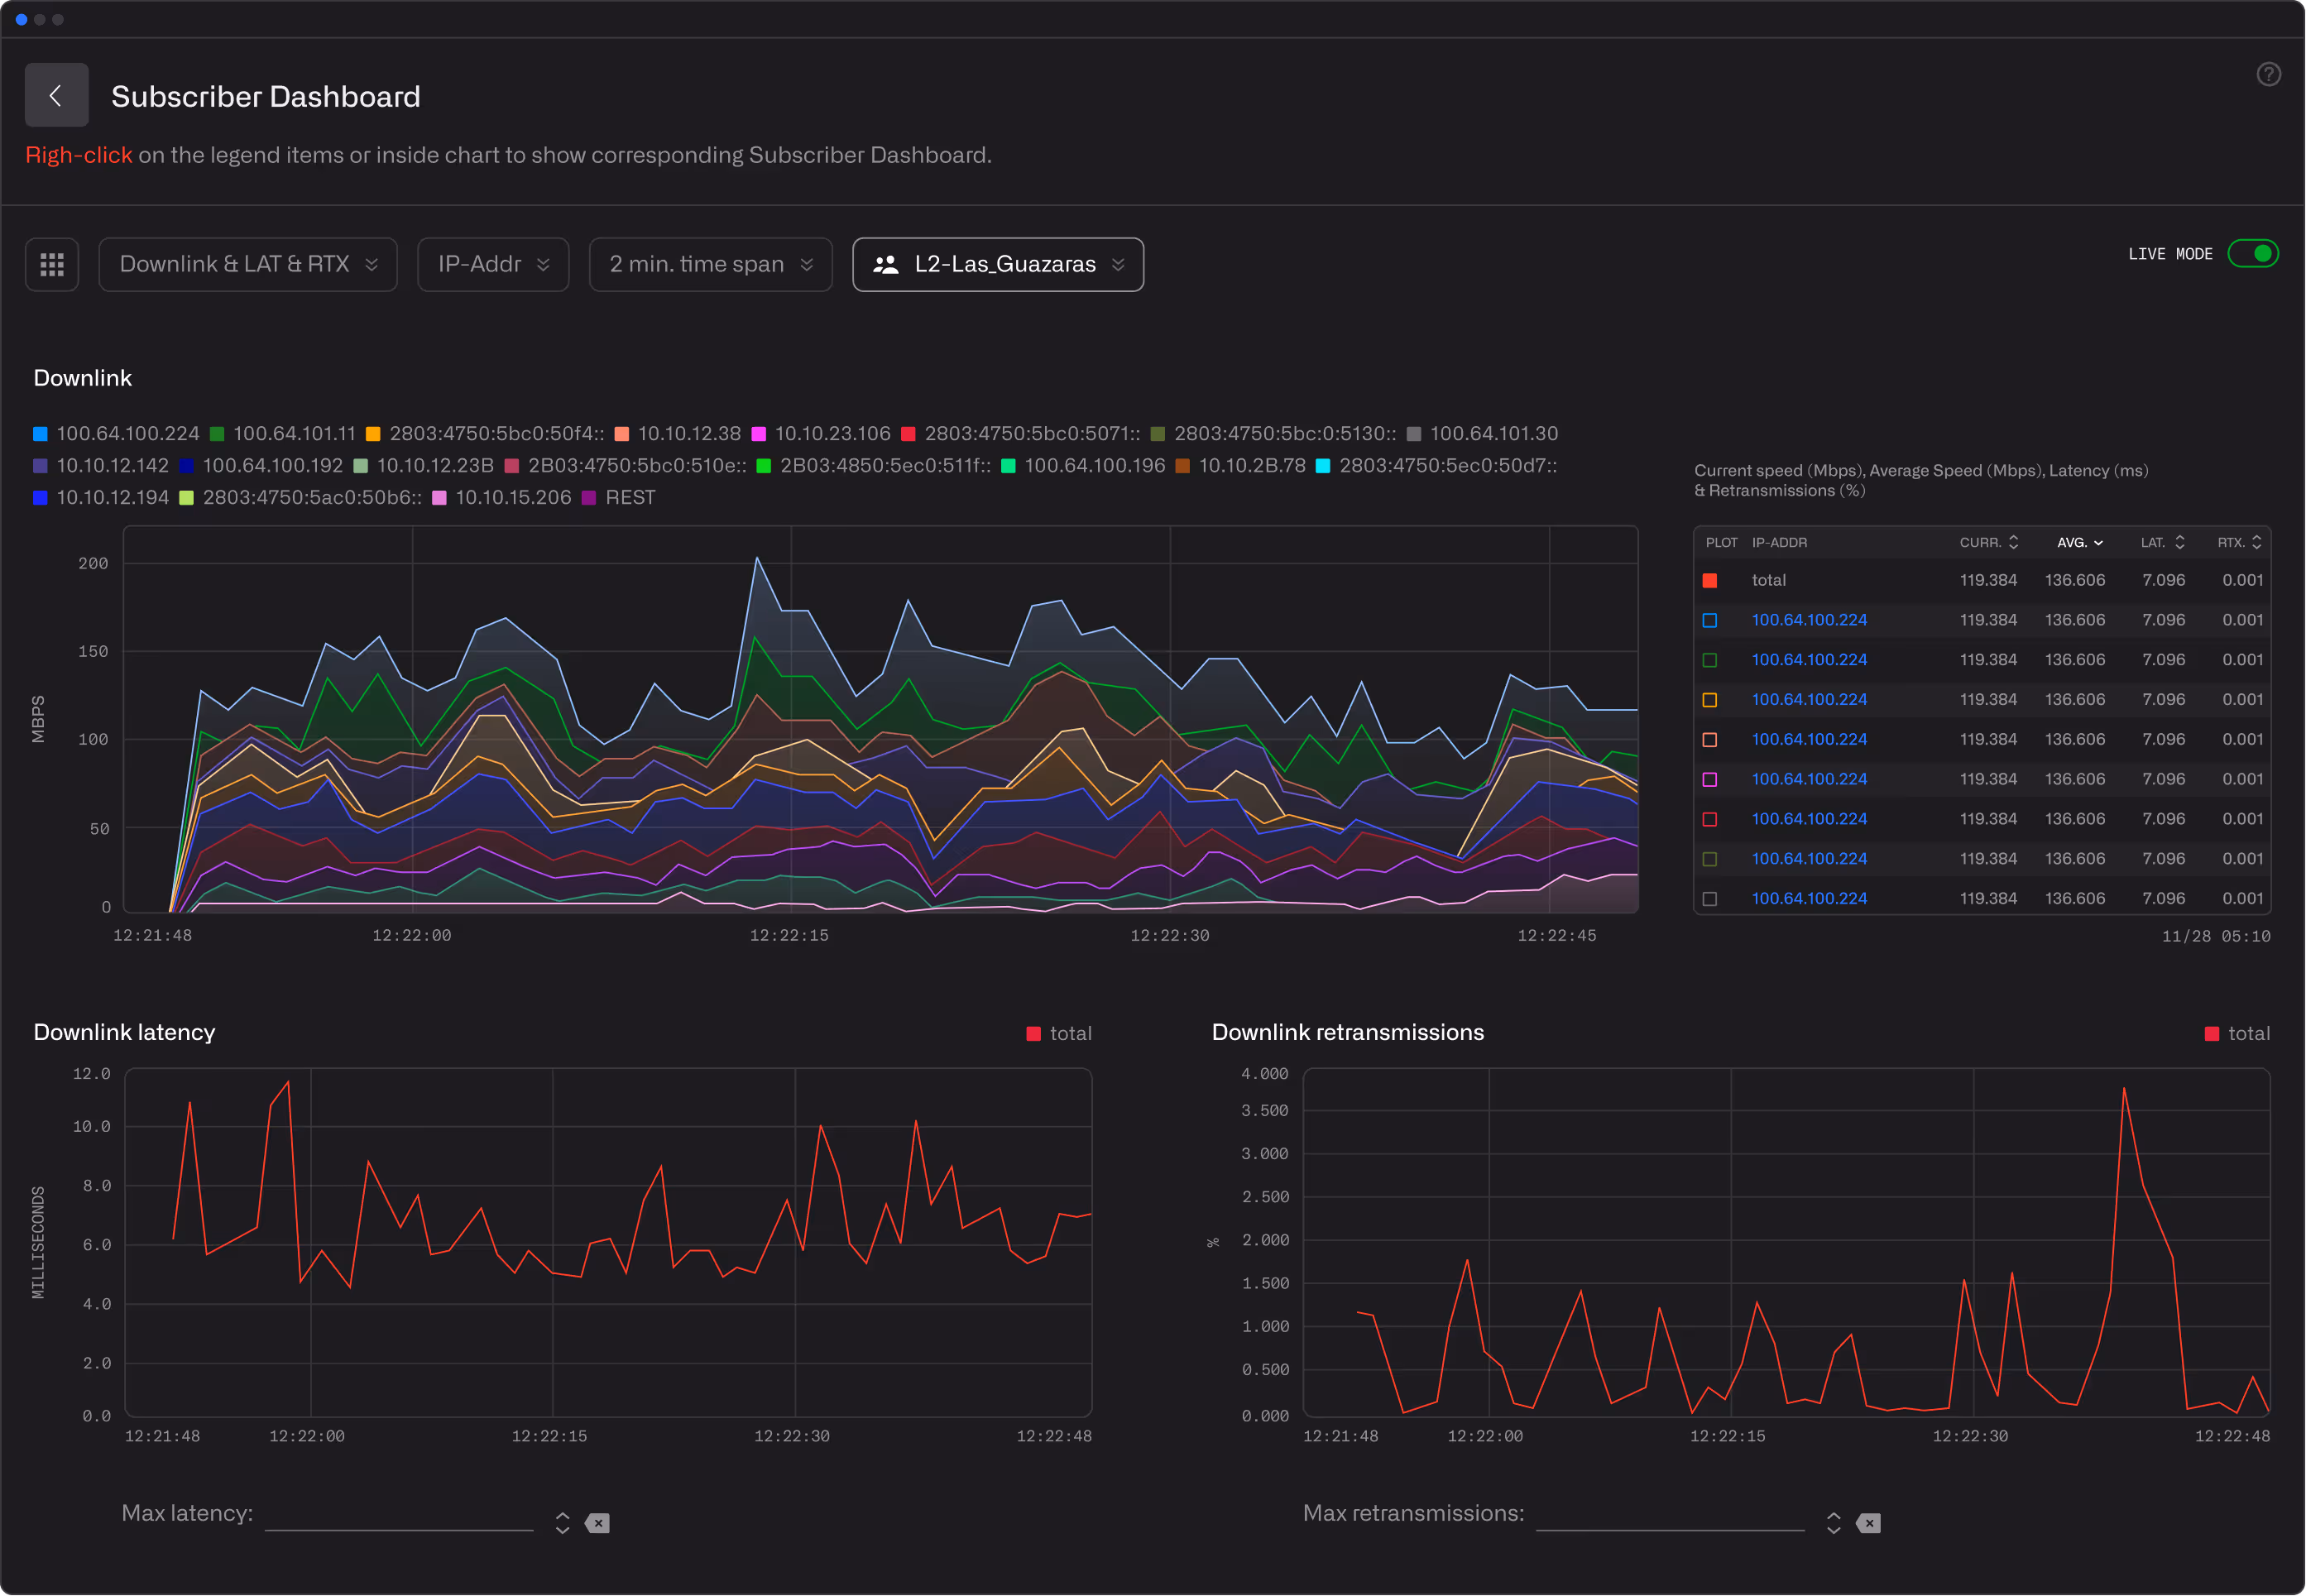
Detailed subscriber metrics
When you need detailed information about one subscriber, the BQN platform will show you three months of data for the key QoE metrics defined above, together with metrics to show the average usage, the effects of ACM on latency and retransmissions and the rate of flow creation.
Finally, our DPI will let you see what are the main services used and the latencies to those services at different points in time, as well as the active flows being used by each subscriber. In summary, a comprehensive view into the status and history of each subscriber.
Lorem Ipsum is simply dummy text of the printing and typesetting industry.


Real-time performance metrics
See throughput, latency, and packet loss in real time.
Track metrics for your entire network or drill down to a single device — such as an access point or OLT port — and identify the most active users with their real-time stats.

Monitor applications
Monitor the performance of applications in your network.
Bequant shows the delay from your network to each application server so you can understand how applications perform and compare results across different Internet service providers.


Percentage of traffic for main clients and servers in tcp:xboxlive.
Identify customer plan upsells
Spot users who consistently reach their plan limits.
Bequant provides metrics that highlight customers who regularly consume all the bandwidth available to them. With this data, you can offer higher-rate plans that better match their needs while also increasing revenue potential.

