Bequant AI Assistant at Work
How ISPs use the BQN AI Assistant to find problem subscribers, analyze application usage, diagnose server alarms, and get step-by-step configuration help — all in plain language.

The BQN AI Assistant lets operators query and manage BQN in plain language, instead of navigating dashboards or building filters by hand. It draws on the same subscriber, application and system metrics that BQN collects for its TCPO, AQM, ACM and DPI functions, so its answers reflect real traffic measured on the network. Answers typically include links to the relevant BQN dashboards, so operators can check the findings and drill down further. The following sections walk through four common tasks, using concrete example prompts.
Identify subscribers with issues
In this example, we are interested in subscribers with degraded experience. Finding them proactively, before they call support, lets the operator fix problems early and reduces complaints and churn. We ask:
Tell me the three subscribers with the worse experience during last week
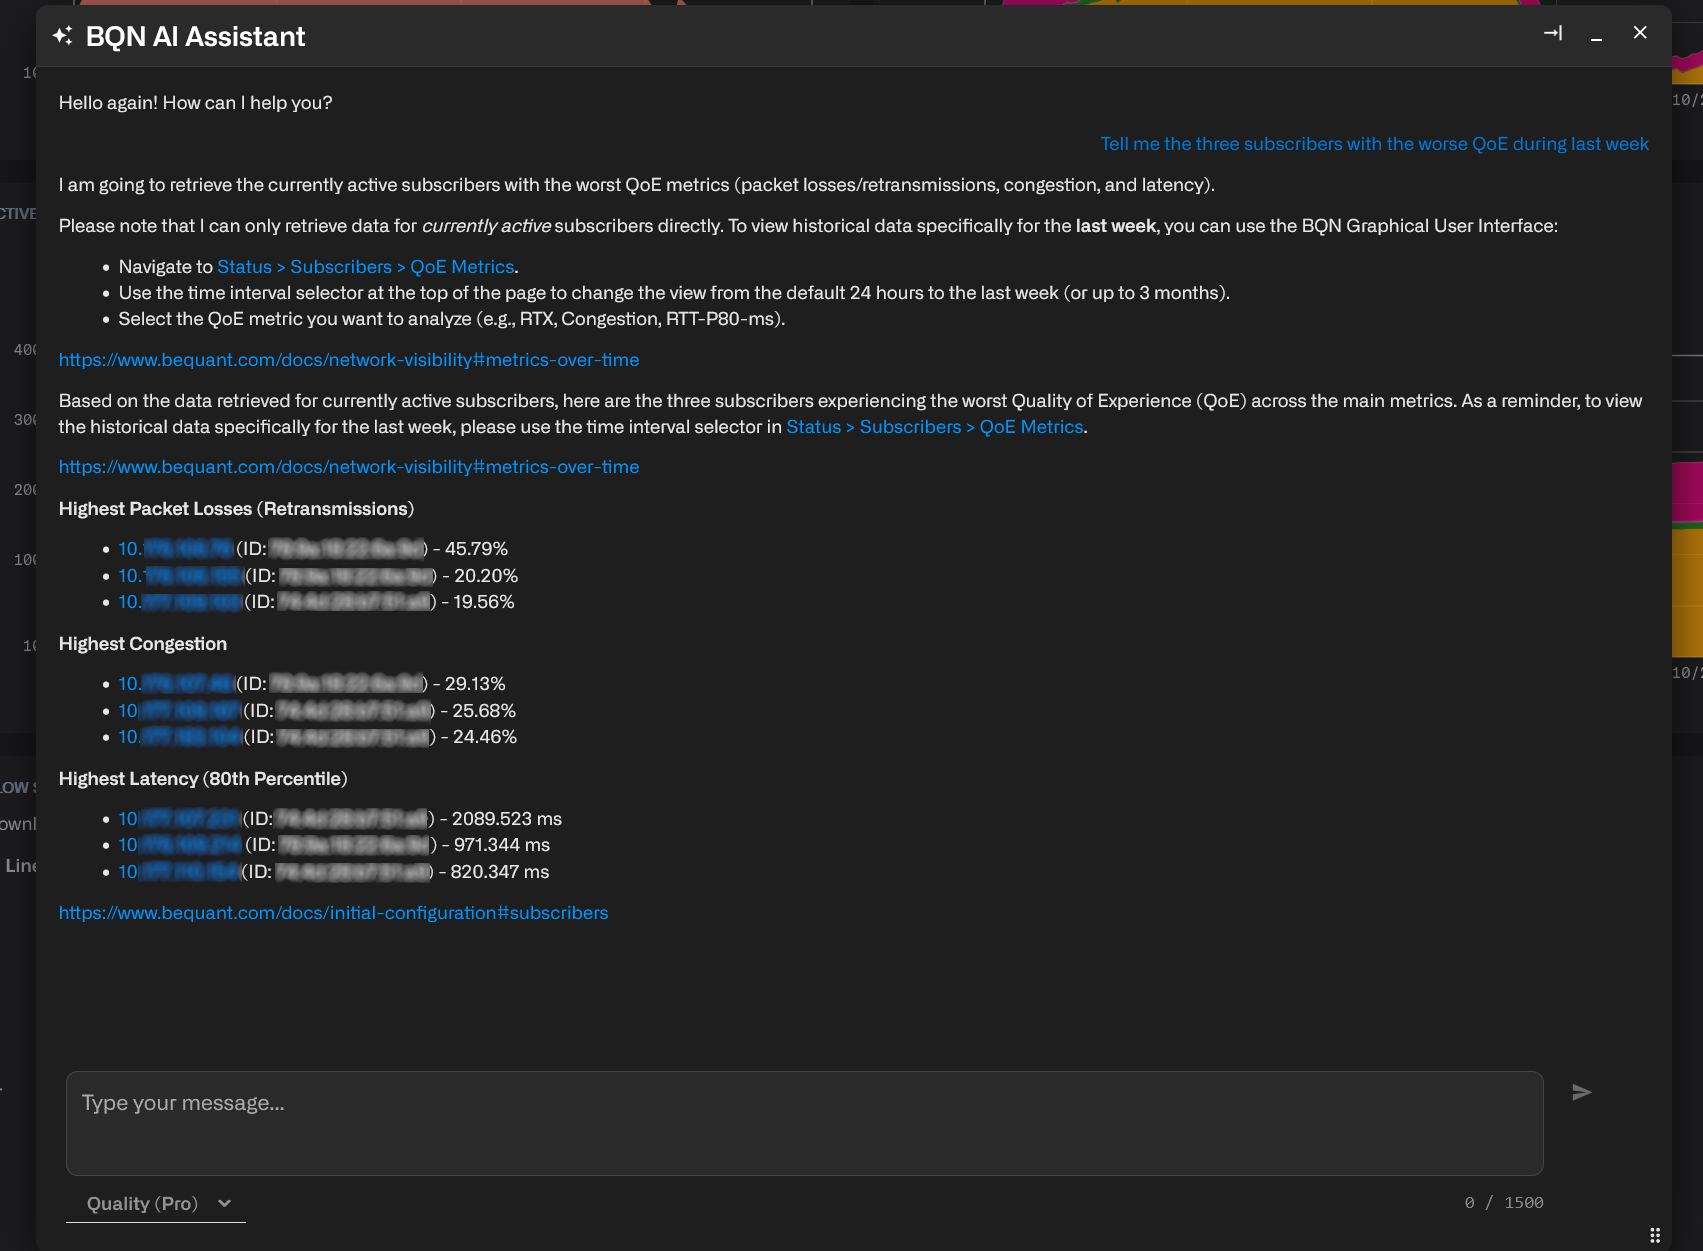
The assistant replies with the three subscribers with the worst experience for each of the three quality KPIs: TCP retransmissions (a sign of packet loss), congestion (how often the subscriber's traffic hits a bottleneck) and latency (round-trip delay). A subscriber who ranks high on more than one KPI is a strong candidate for investigation. Clicking on the subscriber IP shows the dashboard with more detailed metrics:
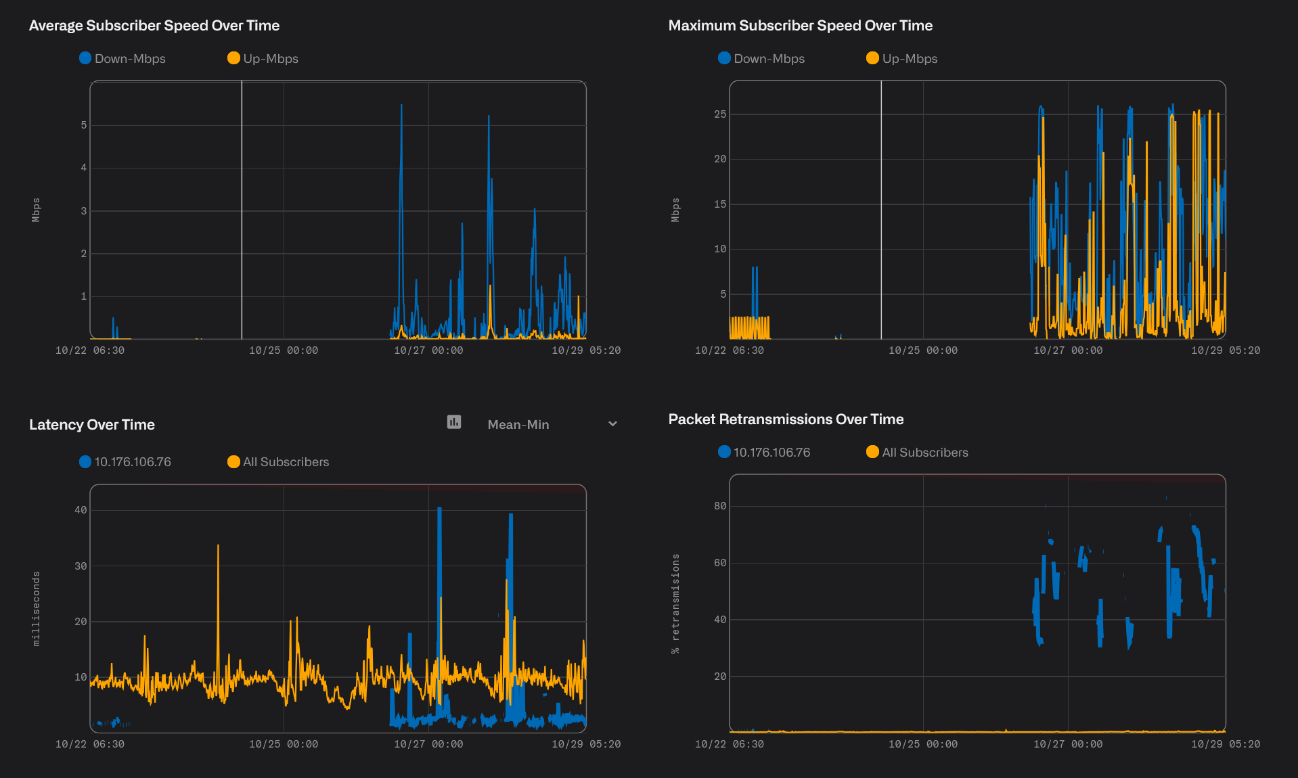
In this example, degraded behavior started a few days ago, after a period of inactivity. When degradation starts at a clear point in time, it usually has a specific cause, such as a new device, a change in the subscriber's equipment or a problem in the access network. That makes it worth investigating.
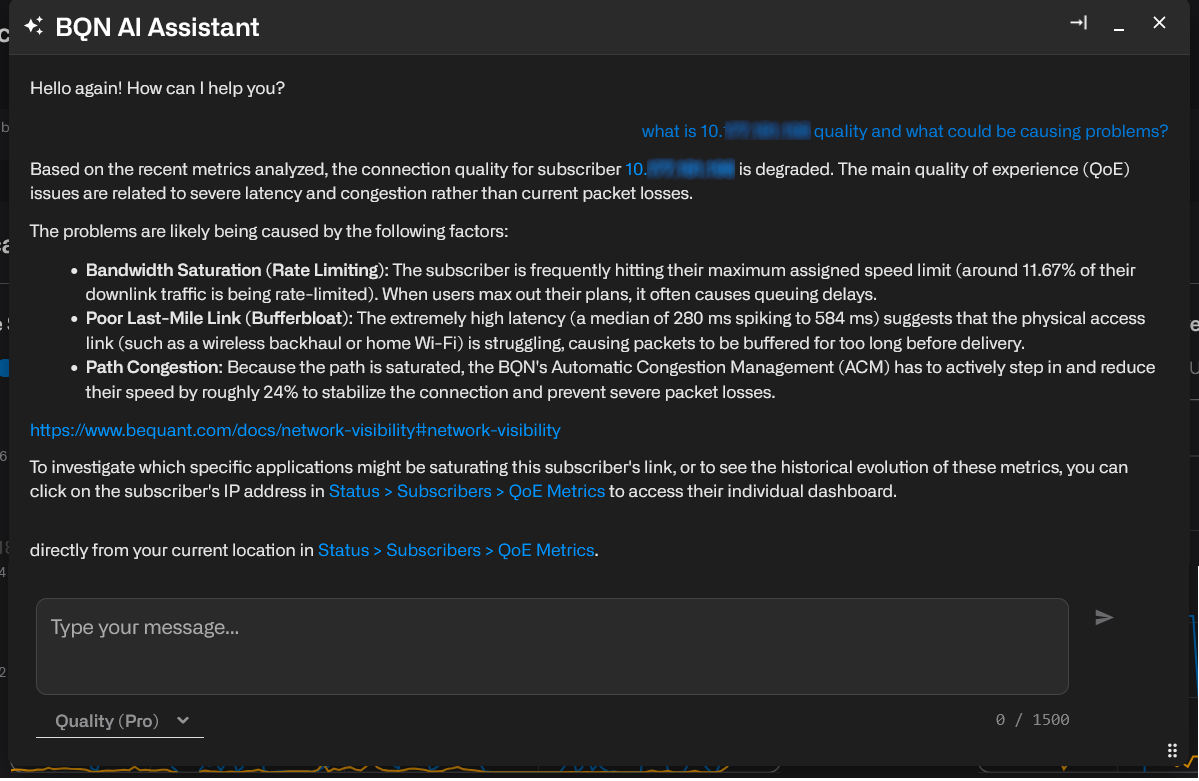
It is also possible to ask about a specific subscriber, for example when a customer calls with a complaint. The assistant summarizes that subscriber's quality and suggests likely causes:
What is 10.x.x.x quality and what could be causing problems.
Learn more about what applications use your network
Application-level visibility, provided by DPI, shows which services drive traffic and how well they perform. Video streaming is usually the largest share of traffic, and peak hour is when congestion is most likely, so it is a good place to start. For example, to get the most popular streaming service at peak:
Tell me the video streaming application with the highest usage during the peak hour and its median latency
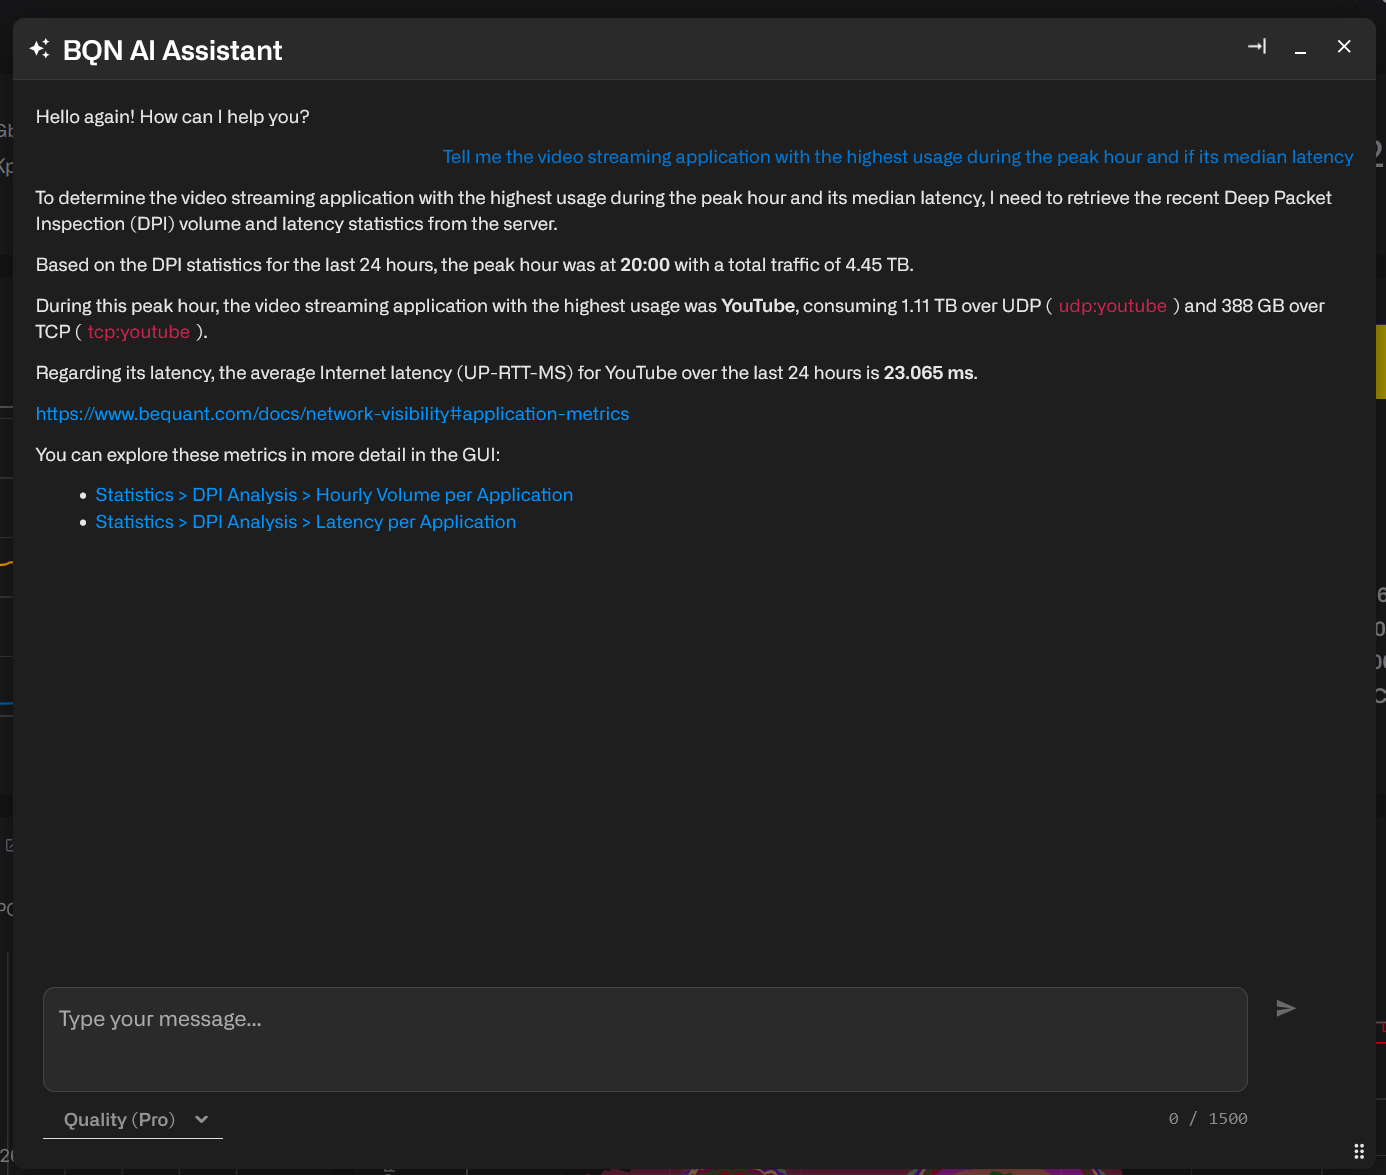
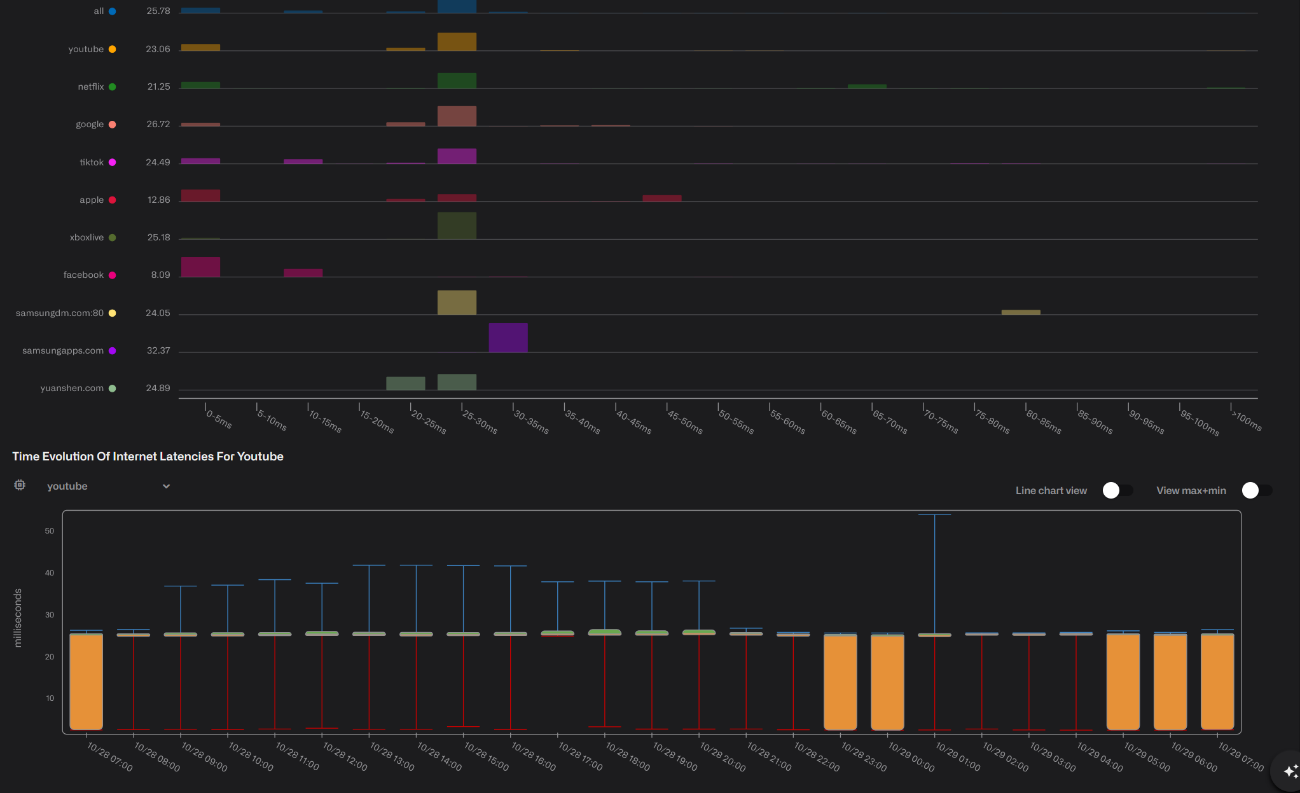
The answer names the application (YouTube in this case) and its median latency. We click on the link to go to the application metrics and see the latency details. Comparing latency at peak and off-peak hours helps show whether the application is affected by network congestion:
Make the system auto-diagnose its status
In this example, the server has an alarm. Instead of checking logs, interfaces and resource usage by hand, we ask the assistant to analyze the server status. It reviews the system and identifies the root cause:
Analyze the status of the server and diagnose any issues you find.
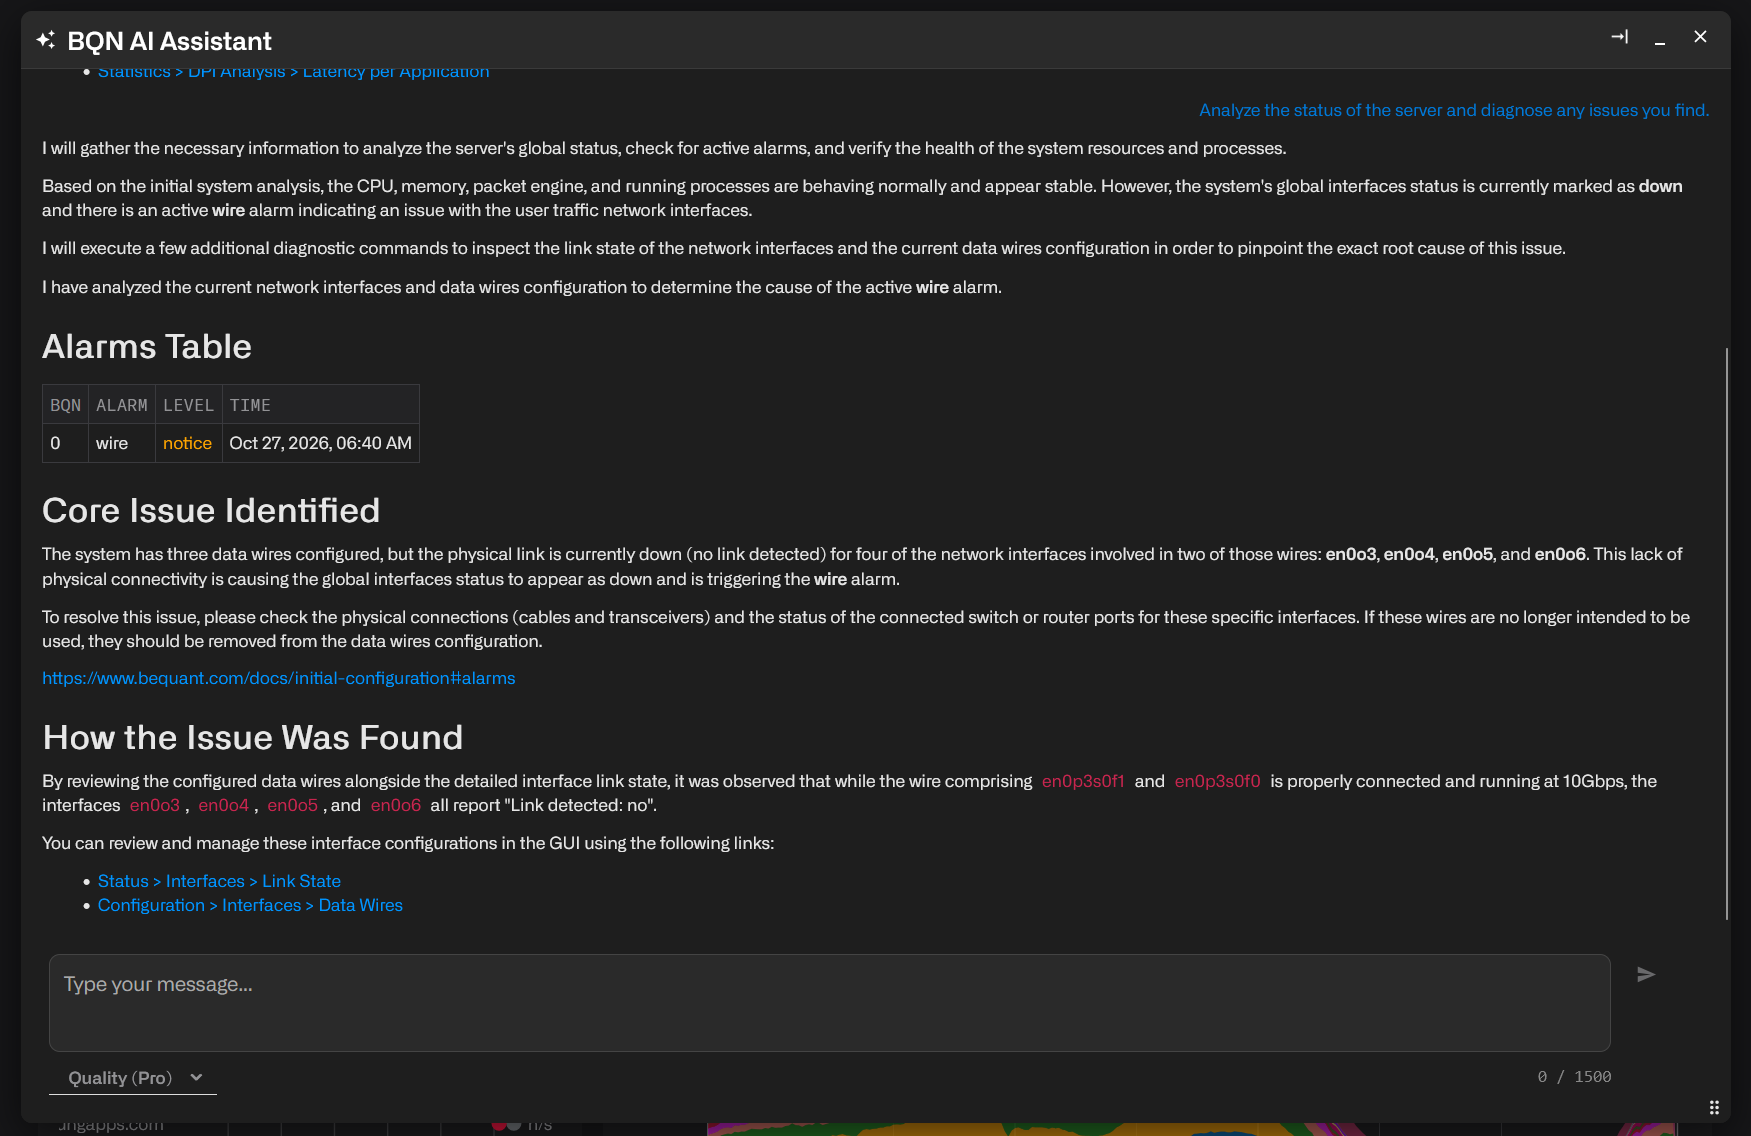
In this case, the cause is that a few wires have no link.
Task-oriented online help
Instead of searching the documentation, tell the assistant what you need and it will generate a series of steps to achieve the goal. This is especially useful for configuration tasks that are done only occasionally, such as setting up a new traffic policy. For example:
I need to limit the maximum speed of a video flow during peak throughput. How do I do it?
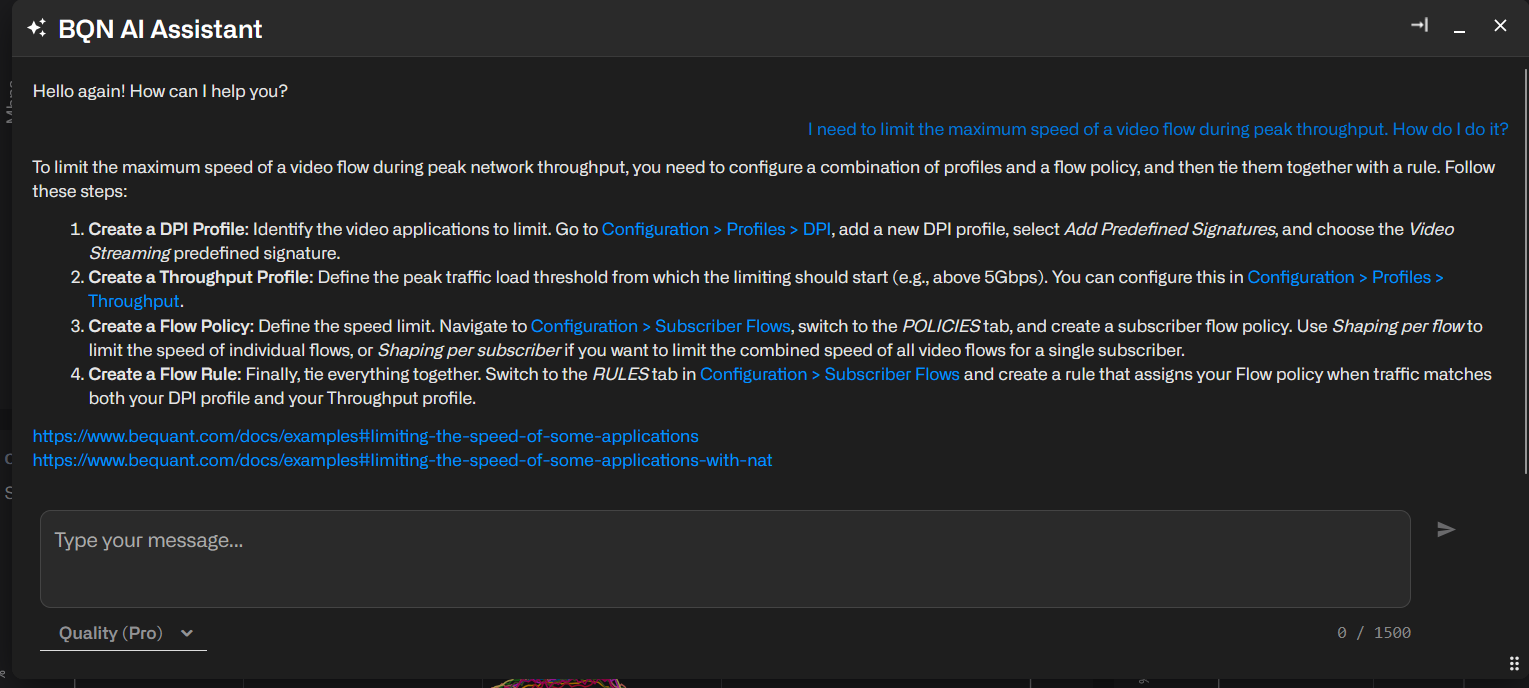
The response includes the profiles, policy and rule needed in this case.