Reducing Customer Churn through Network KPIs
Churn is expensive: ISPs lose current and future revenue, plus $135–$500 to acquire each replacement customer—and most subscribers leave without ever complaining. This brief shows how monitoring per-subscriber, per-application KPIs (throughput, latency, packet loss, application performance) lets operations, support, and sales teams fix issues before subscribers churn. A Bequant QoE appliance at the network core delivers that visibility and control, improving retention and ARPU with projected ROI in under a year.

Background: Losing Customers Costs More Than You Think
Not considering personal financial circumstances, subscriber churn happens when a customer is so dissatisfied with your service that they switch to a competitor. For an ISP, this has real, measurable consequences:
- You lose not only current monthly revenue, but also the future revenue stream that the customer would have provided.
- You incur acquisition costs to replace the lost subscriber – marketing, installation, onboarding all cost money.
- You lose trust and your relationship with that subscriber, which may lead to negative word-of-mouth or online reviews.
- A single displeased customer may influence others and harm your brand reputation.
Reasons for churn
- Poor network quality & reliability.
- High or confusing pricing.
- Ineffective customer service & long wait times.Attractive offers from competitors.
This document focuses on how ISPs can proactively detect and remedy service issues before subscribers decide to churn.
Market studies show Customer Acquisition Costs (CAC: marketing, sales, installation) range between $135 and $500 per residential subscriber depending on broadband technology, geographic area, scale, self-installation, truck-roll rates and other factors. Reducing churn even modestly has an outsized impact on profitability. Therefore, investing in tools that effectively reduce churn can deliver a strong return on investment.
Why Do Customers Leave?
In the FTTH (Fiber to the Home) market, annual churn typically ranges between 2% and 4%. Academic and industry analyses of fixed wireless and regional ISPs indicate churn tends to vary — approximately 1% to 5% annually, depending on competitive pressure, reliability, and local market dynamics.
In broad terms there are three primary drivers of churn:
- Pricing: If your rates become uncompetitive or you raise prices without justified value, subscribers may walk.
- Network: Performance, reliability, and service quality play a major role in customer satisfaction.
- Support: If customer-facing support is slow, ineffective or appears disconnected from underlying network issues, clients may get frustrated.
In this brief we focus on the Network and Support dimensions — how you can monitor and act on underlying network performance and how you enable your team to respond more effectively.
The Issue: What Triggers Churn?
Users rarely call their ISPs when everything is fine; they call when something is wrong. And when things are wrong, they may not call; if they then receive a solicitation from a competing ISP, they will be much more likely to switch.
Imagine a subscriber whose plan promises 500 Mbps downstream on fiber or 100 Mbps on fixed wireless broadband. The FTTH subscriber may not call when they actually get 480-500 Mbps (or 90-100 Mbps in the FWB case). But they will call, or become easy prey for your competitor, if:
- A speed test shows significantly less than the advertised rate.
- A key application — streaming video, gaming, teleconferencing — behaves poorly. Think the spinning "loading" icon, laggy game play, and stuttering conference calls.
Often the problem is not simply raw throughput. It's what happens in spite of that: CPE (customer premise equipment) or Wi-Fi router buffer bloat and its direct network effects on latency / delays, packet retransmissions, and jitter. A gaming user may call and say: "It's laggy" — that delay often ties back to network latency or packet loss rather than just a low Mbps number.
The Consequence: You May Not Even See the Churn Coming
Without visibility into the right network key performance indicators (KPIs) on a per-subscriber, per-application basis — including through to the home Wi-Fi or fixed wireless CPE — you may be blind. You may only see subscriber complaints after they decide to leave.
What's Missing: Visibility into KPIs and Real Experience
Building, funding, operating, and scaling a service provider network is resource intensive. Providing a high-speed, low-latency, highly reliable, cost-competitive service with responsive support is not easy. Common headwinds to success are:
- Not tracking the primary Quality of Experience (QoE) metrics: throughput, latency, TCP packet retransmissions, or application-specific performance at the subscriber-level and in real time.
- Lack of control and/or observability into home Wi-Fi & customer-premises equipment (CPE).
- Until recently, obtaining both real-time & historical data per-subscriber and per-application has required major investment in hardware, software, and analytics.
What to Monitor to Reduce Churn
To get ahead of churn and see customer performance issues as or before they occur, you should monitor the following.
- Throughput: Are subscribers getting close to or substantially below their rate-plan speeds?
- Latency: This includes both
- Between your network core and subscriber, aka access latency; and
- Between your network core and cloud-based content servers, aka internet latency.
- Between your network core and subscriber, aka access latency; and
- Packet loss, very common in wireless networks, which can be measured through TCP packet retransmissions (ReTx): a proxy for network inefficiencies.
- Application-level performance: How are streaming, gaming, and conferencing apps behaving?
- And do these measurements at the subscriber level, and ideally at each network element (access link, backhaul, home Wi-Fi).
By proactively monitoring these items and putting support and sales processes in place that leverage and act on these metrics, you can:
- Spot customers with sustained poor KPIs: high latency, high TCP retransmission, etc. — this is your early-warning for potential churn.
- Identify customers who consistently max out their rate plan — this can signal an upsell opportunity to increase ARPU.
- Engage with those customers before they call or leave — you have a chance to retain them rather than recover them.
Bottom Line: You cannot manage what you do not monitor.
A Possible Solution: Visibility + Network Optimization + Proactive Action
Monitoring your network at the application and subscriber level
By deploying a Bequant QoE appliance in the core of your network, so that all access network traffic in both directions flows through it, you gain network optimization, visibility and control. The BQN platform offers these key benefits.
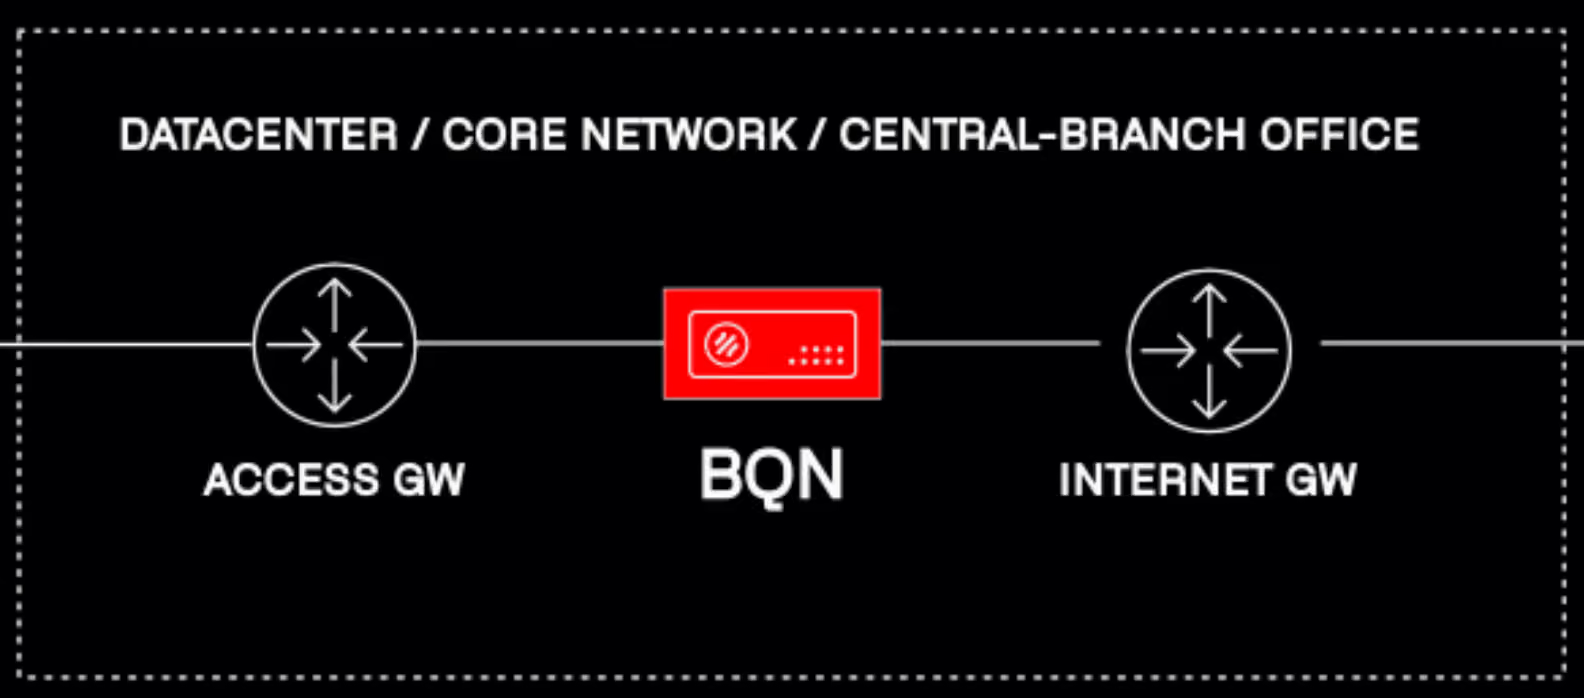
- TCPO — TCP Optimization. Acting as a transparent TCP proxy between content servers and end-user device traffic flows, Bequant's patented TCPO algorithms reduces retransmissions & latency and accelerate TCP traffic.
- DPI — Deep Packet Inspection. Enables application identification & classification to provide network visibility and is used by our bandwidth management.
- ACM — Auto-Congestion Management. AI-powered congestion detection and mitigation per individual customer, even when plan limits are unknown or not reached.
- AQM — Active Queue Management. Minimizes latency during peak usage by creating queues per application flow with automatic prioritization of interactive traffic, teleconferencing, gaming, and other latency-sensitive applications.
- Bandwidth Management — Combined with AQM, enables the most flexible allocation of network resources and provides the best possible QoE. Rate limitations at different levels: per flow, DPI-policy, application flows, user, user group, or network element.
- Network Visibility — Leveraging DPI, obtain deep subscriber KPI. Real-time and historical metrics at user, group and network level, for better and more proactive customer support.
- App-based Prioritization — Prioritize latency-sensitive apps like video conferencing. Offer great gaming experience even when other subscriber's devices are performing massive software downloads.
- Speed Test Optimization — Allows speed tests to always reach subscriber's rate plan, even in the presence of background applications.
- Billing System Integration — Synchronize and enforce rate plans in BQN along with performing network optimization.
- Scalability — From 1 Gbps up to 400 Gbps in a single server. Manage multiple BQN servers as a cluster.
Specific Benefits to Your Network and Subscriber Experience
"QoE has reduced our churn from a couple of customers per week to zero! That alone justified the cost of Bequant QoE."
Brandon Shiers, wyoming.com
As a baseline, the combination of TCPO and ACM work automatically and proactively in the background to significantly improve network performance. These Bequant-proprietary capabilities provide:
- Faster game play and high-quality video streaming experiences from reduced latencies across the network.
- Smoother teleconferencing even in the presence of heavy background traffic.
- Faster downloads/uploads and fewer complaints due to reduced network congestion and higher network quality / efficiency.
Adding DPI-based application optimizations & packet prioritization on top of these controls, ISPs will experience:
- Fewer support calls due to poor speed test results, even with heavy background traffic.
- An opportunity to put more subscribers on a given network segment.
Then with DPI providing granular visibility, tracking, and flagging KPIs, ISPs can:
- Proactively take action to address performance issues before the subscriber calls occur.
- Solve those network performance issues faster.
Empowering Your Teams — Operations, Support, and Sales
For operations / NOC teams
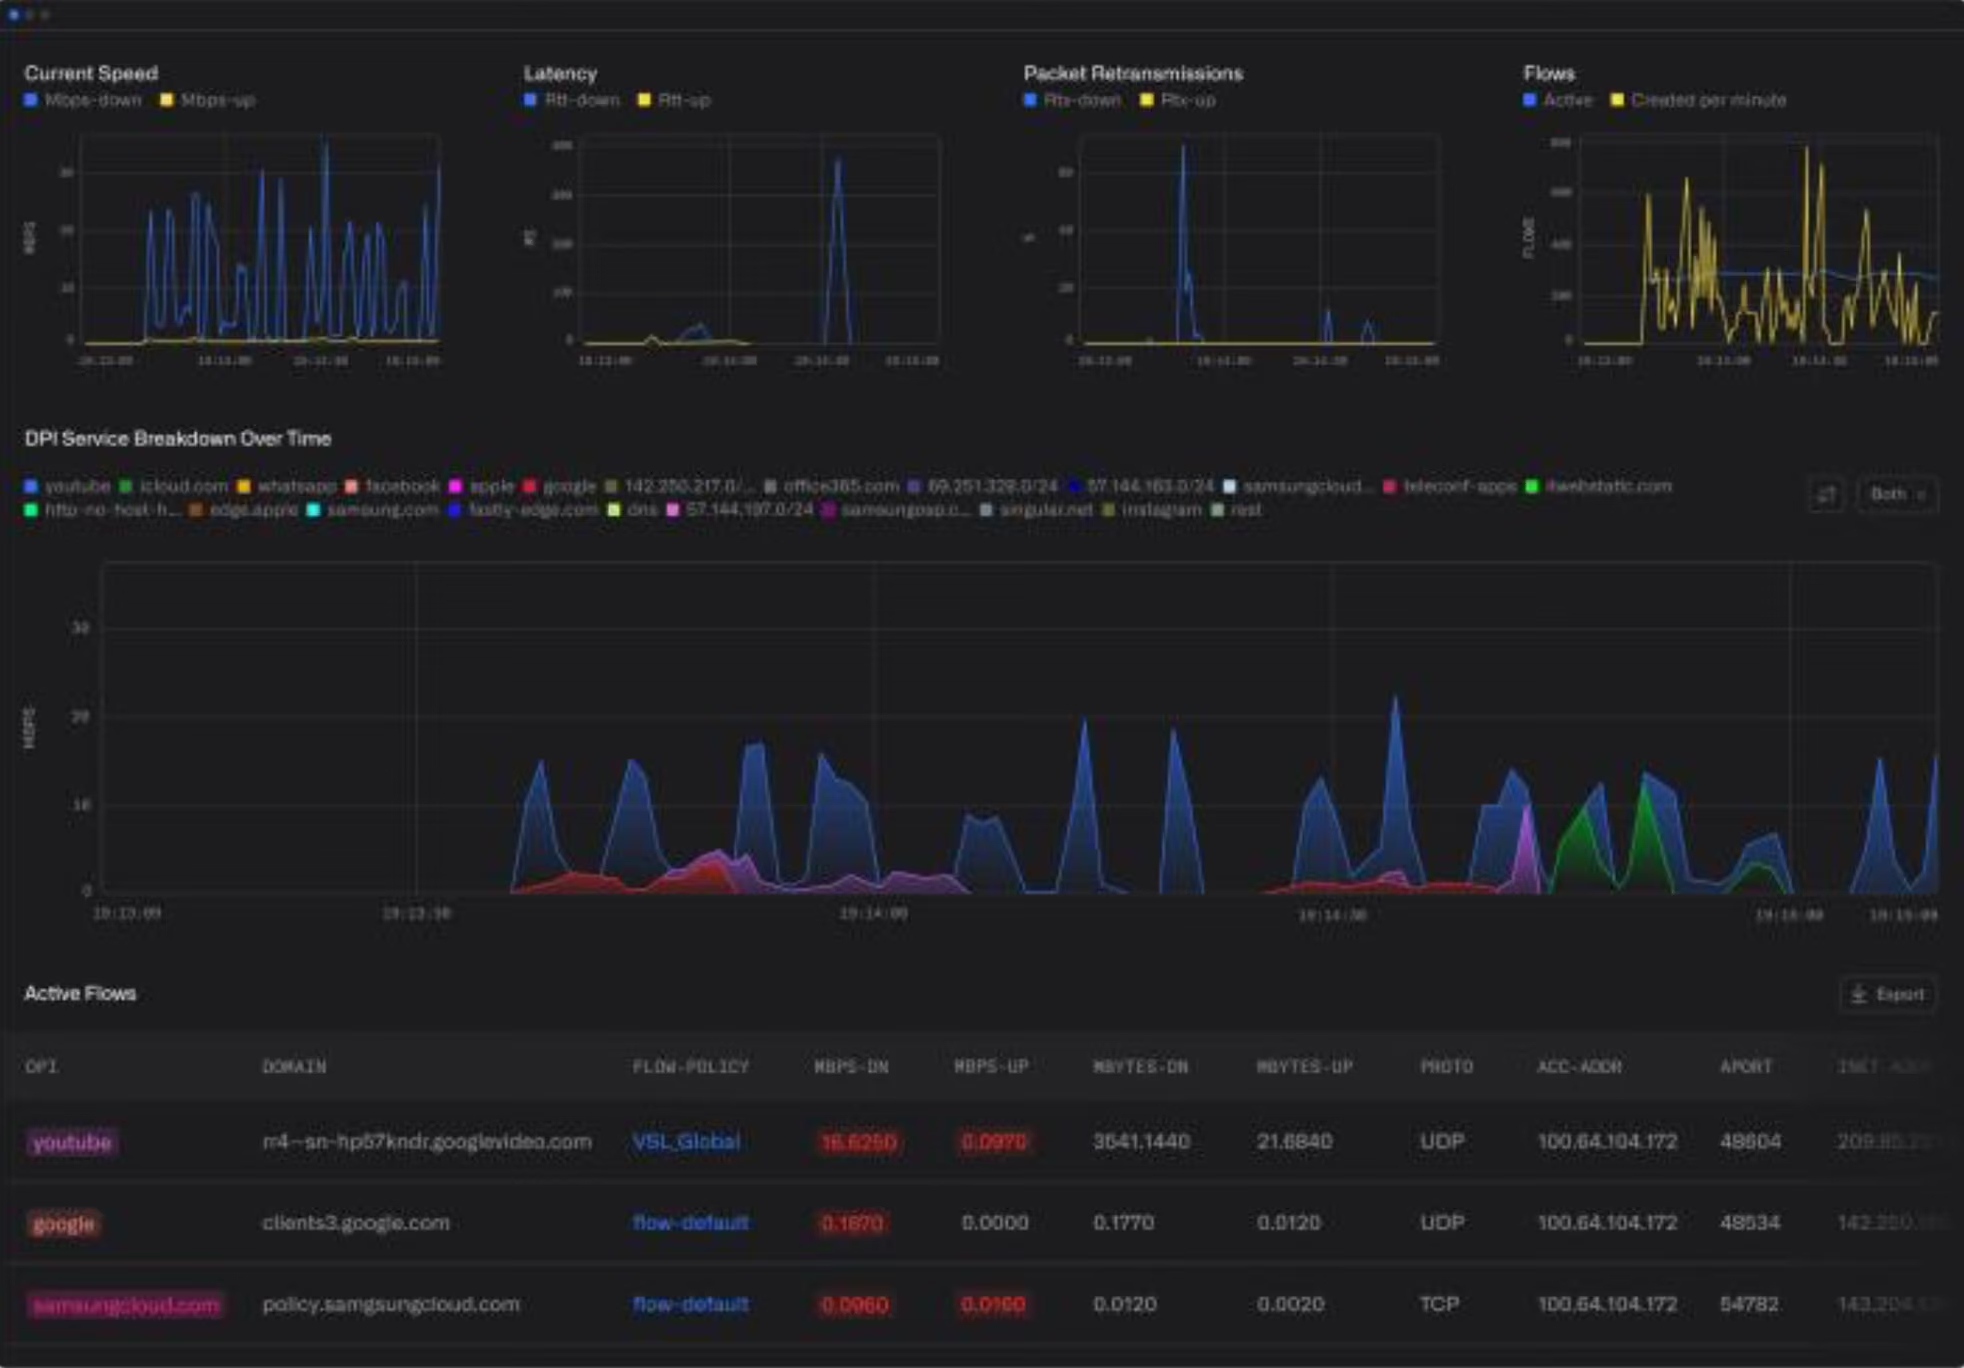
With DPI, Ops gains visibility into real-time and historical application performance (Netflix, Zoom, gaming) which speeds diagnostics at the network level. Additionally, they can see per-subscriber KPIs and decide whether an issue is one-off or chronic and so determine if an on-site dispatch is needed.
For customer support teams
With TCPO, ACM, AQM, and speed test optimization, CSRs will receive fewer support calls due to network performance issues. In addition, if a performance issue does arise, they will have visibility into the home network path (through to the CPE or Wi-Fi) so that they can correlate complaints ("My video stutters") with network data (latency spikes, retransmission counts) — reducing resolution time and increasing customer satisfaction.
They can also proactively review a list of top subscribers with poor KPIs and engage customers before churn risk becomes real.
For sales/marketing teams
By flagging subscribers with sub-par KPIs, you can engage them proactively with offers or remediation before they become attrition risks. And by identifying subscribers who consistently hit their rate-plan capacity, you have built-in upsell opportunities — offering a higher tier plan becomes a logical conversation rather than a gamble. Sales / Retention teams could follow a proactive process such as:
- Weekly run: export top at-risk subscribers and top upsell candidates.
- For at-risk: run a 2-touch program — automated email (education + offer: free diagnostics) then a personalized call from retention team if still flagged after 7 days.
- For upsell: present usage evidence, example: "You regularly hit 90%+ of your current plan — here's a higher-speed plan that suits your needs".
An Alternative Solution: Subscriber Outreach
An alternative to proactive, quantitative monitoring and proactive action is to survey customers via phone, mail-in, email, or social media to gauge their perceived quality of experience. While this can provide useful feedback, its limitations include:
- Higher cost of execution: staff time, survey tools.
- Typically, low response rate: you may not reach the customers who are about to churn.
- The need to do it very regularly to stay current.
Useful? Yes, but not sufficient by itself to stay ahead of churn. In the event of a churn, a best practice includes a customer 'exit survey' as feedback to improve operations and inform market competitiveness analyses.
An ROI Model with Quick Return
This analysis models a medium sized ISP with a current churn rate of just over 3.3%.
This model assumes:
- Churn can be reduced by a modest 0.35%.
- Average savings of one trouble ticket per retained subscriber per year.
- Exclusion of any potential ARPU improvement as a result of upselling to higher rate plans.
Results: a projected net positive cash flow and ROI under one year.
Summary
Every ISP — whether delivering FTTH, fixed wireless broadband, hybrid fiber-coax (HFC) or other access technologies — battles the twin threats of customer churn and rising acquisition cost.
The key to mitigating these threats is better QoE and visibility — knowing what the subscriber is actually experiencing — and proactive action — acting early enough to retain rather than replace.
The Bequant BQN platform addresses these challenges by delivering:
- TCP Optimization to accelerate traffic and reduce customer complaints of low speeds or slow responses.
- Advanced Bandwidth Management and ACM to preserve quality of experience even when the network is stressed.
- Subscriber-level Network Visibility to monitor QoE and engage exactly where intervention will matter most.
- Speed Test Optimization.
By deploying the BQN platform, ISPs can retain revenue, improve customer satisfaction, lower the cost of replacement customer acquisition through improved retention and upsell.
The Time to Act Is Now
- Reach out to current BQN users and ask for their experience and outcomes — hearing from peers is always helpful.
- Contact Bequant and request a 30-day, no-cost, no-pressure trial. Test it on your network and measure the difference in KPIs, and customer complaints.
- Set up your internal team -- operations, support, sales -- with a dashboard of key QoE metrics.
By adopting an end-to-end strategy — from data collection through action — you turn network performance from a reactive cost center into a strategic asset for subscriber retention, satisfaction and growth.