
Logging in
The BQN has a web-based Graphic User Interface (GUI) to perform the most common management tasks. Desktop browsers Chrome, Firefox, Safari and Microsoft Edge are supported (MS Explorer is not).
The GUI has contextual help: press the ? help icon on the page for which help is needed.
To access the GUI, open a browser and visit the URL: https://oam-ip, where oam-ip is the management IP address (192.168.0.121 by default).
The BQN uses a self-signed certificate, and the browser will signal it as unsecure. Ignore the warning and go to the web page.
Enter bqnadm user and the password:
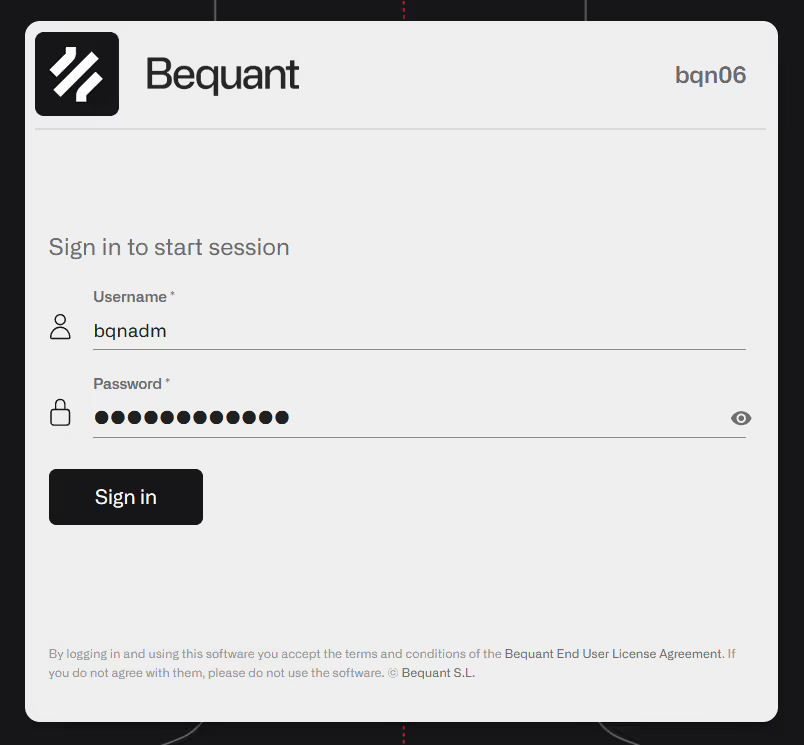
User root cannot be used to log into the GUI.
Initial Dashboard Page
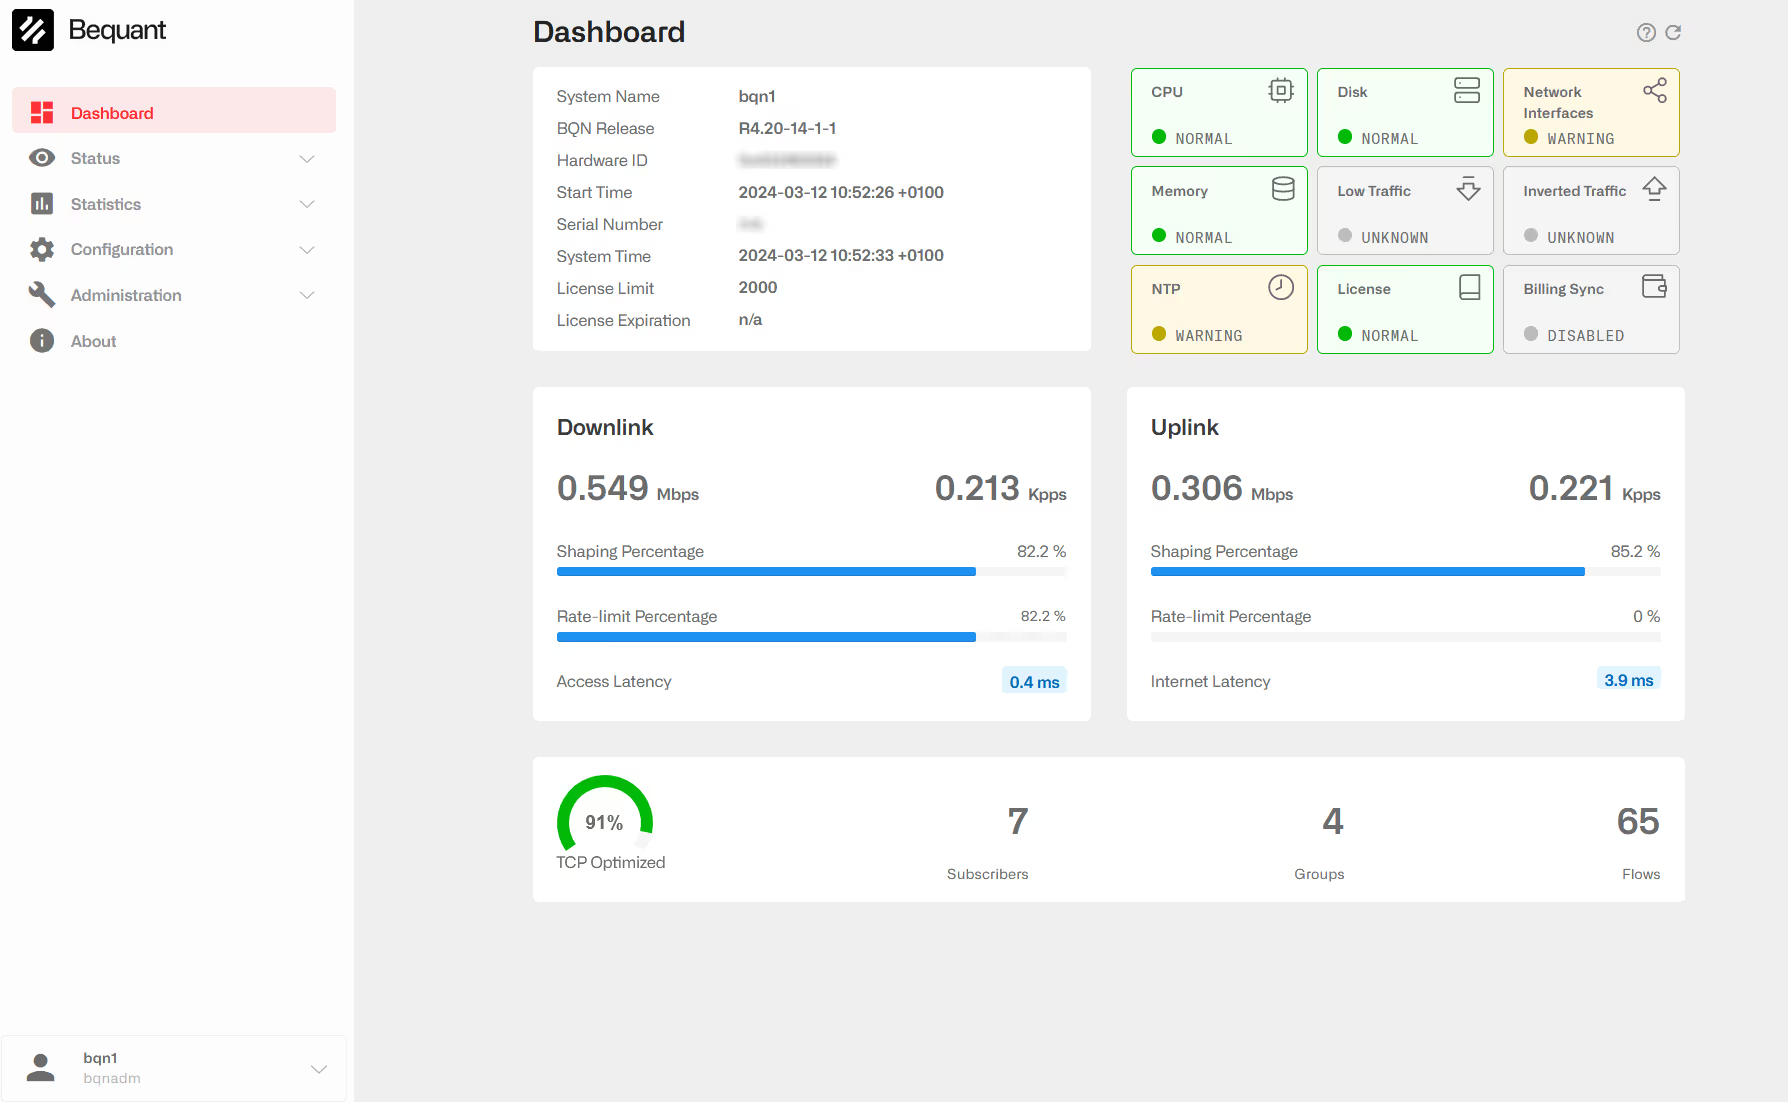
The home page has a lateral menu, a dashboard, and a small summary of system information.
The dashboard must show all icons in green. The Network Interfaces icon will not be green until all the configured wires are connected (if there are interfaces not being used in any of the configured wires, it will remain in orange) and the icon Low Traffic will not be in green until the traffic flows through the BQN. In some icons, clicking on them goes to a window with more information about the BQN status. See below Troubleshooting for steps to take when an icon is not in normal state.
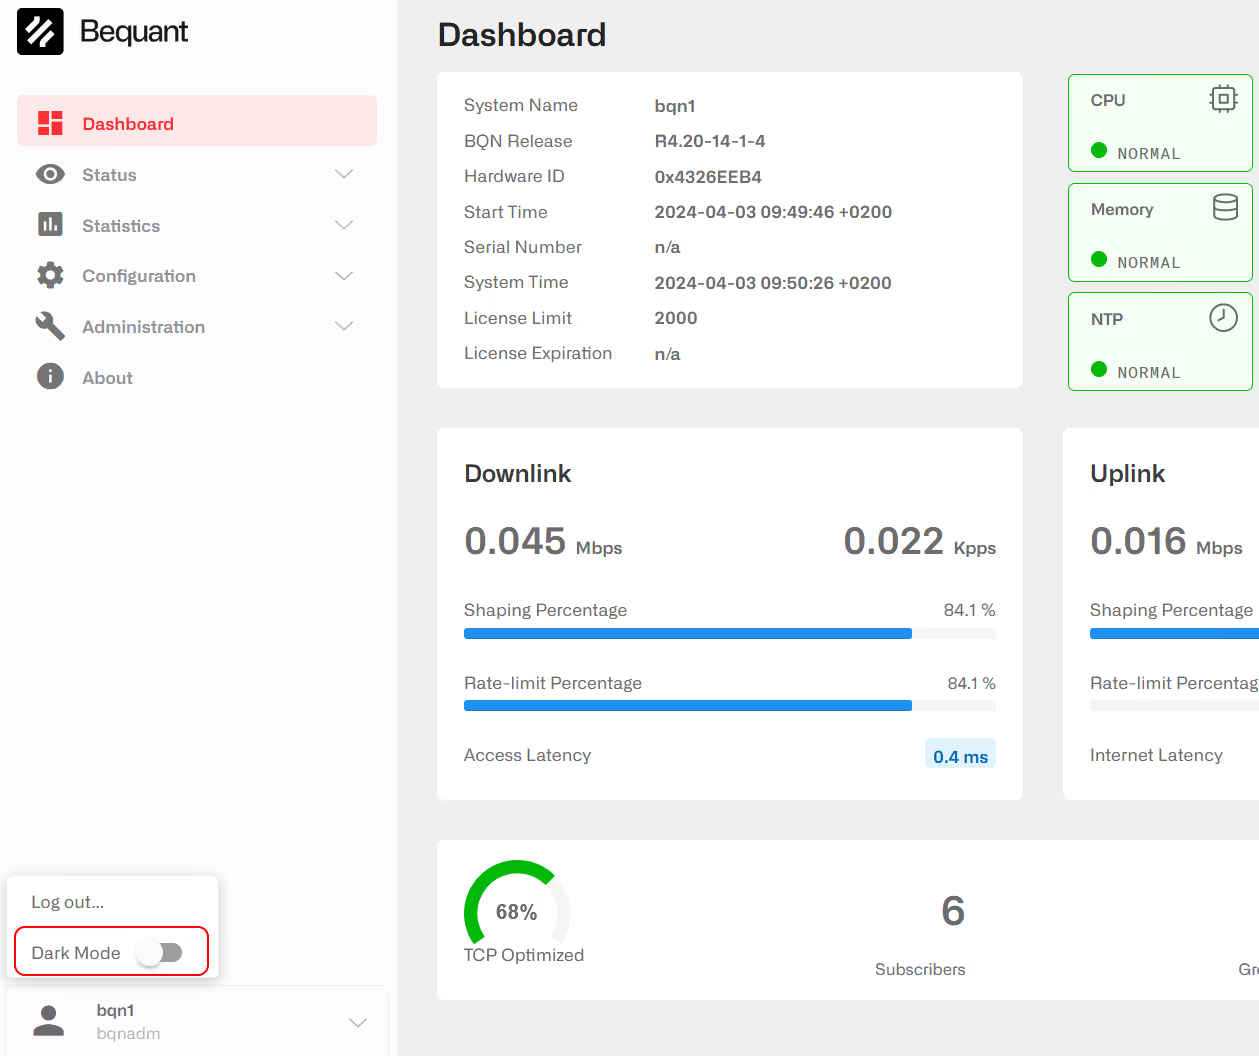
The GUI supports dark mode. You can change between dark and clear mode clicking on the user area in the bottom right corner and changing the Dark Mode switch.
New Dashboard Page
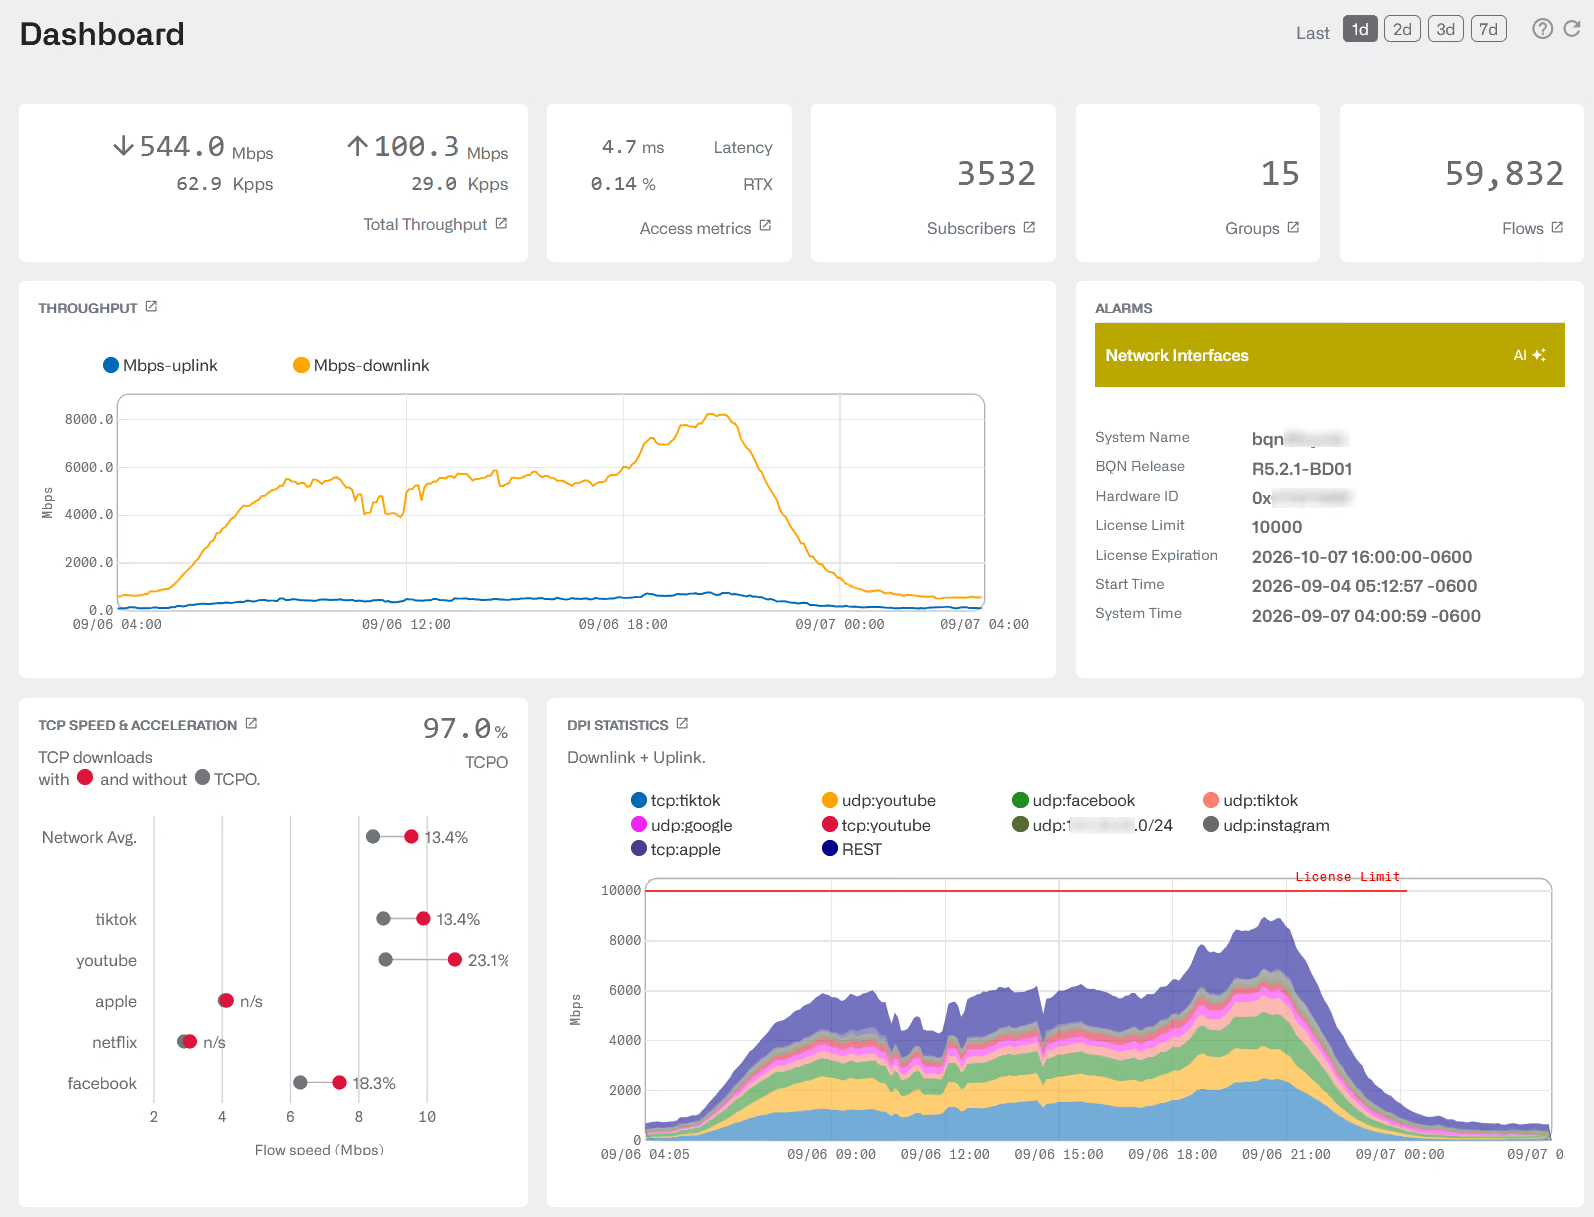
From R5.2, the dashboard has been redesigned to include more relevant information on it.
The dashboard page shows theoverall status of the BQN: its alarms and system information, the traffic it is passing right now and the evolution over the selected period of the main system, subscriber and application metrics.
Most panels are links. Click on a panel title marked with the launch icon to open the page with the fullinformation, and on a value to open the page it comes from. The pages opened this way have a back button that returns to the dashboard, and the ones showing an evolution over time open with the period selected here.
Selectors:
- Last 1d / 2d /3d / 7d: the period covered by thecharts and tables that show an evolution over time (last 24 hours, 2, 3 or 7 days).
- (HELP): opens this help.
- (REFRESH): reloads every panel. Without it, the live values (throughput, packet rate,latency and retransmissions) refresh every 2 seconds, the alarms and counter severy 15 seconds, and the charts and tables every 5 minutes. Nothing is refreshed while the browser tab is hidden.
- In a cluster,the selector in the upper right chooses the BQN shown (or all of them), and the back arrow leads to the cluster dashboard. If the BQN shown goes offline, the dashboard switches to the whole cluster.
A panel shows "Unknown" or "n/a" while its data has not arrived yet, and "No data available" when the BQN reports nothing for the selected period.
Total Throughput
Current downlink (down arrow) and uplink (up arrow) throughput, in Mbps (Gbps when above 1000 Mbps), with the packets per second (Kpps or Mpps) below each of them. They are computed from two consecutive samples, so "n/a" is shown until the second one arrives.
Click on a throughput value to go to Statistics->Throughput->Live Subscribers in that direction, and on a packet rate to go to Statistics->Throughput->Overview.
Access metrics
- Latency: median round-trip time, in the last interval,between the BQN and the subscribers (access side, downlink direction). Click to go to Statistics->System->Latency.
- RTX: percentage of TCP retransmissions on the access side in the last seconds, which reflects packet losses towards the subscribers. Click to go to Statistics->System->Retransmissions.
Click on the panel title to go to Statistics->Congestion Metrics.
Subscribers,Groups and Flows
- Subscribers: active subscribers (one access IP address counted as one subscriber). Click to go to Status->Subscribers->QoE Metrics.
- Groups: active subscriber groups. Click to go to Status->Subscribers->Subscriber Groups.
- Flows: active flows (TCP connections, UDP flows and other IP protocol flows). Click to go to Status->Flows->Details.
Throughput
Maximum downlink and uplink throughput, in Mbps, over the selected period. Click on the title to go to Statistics->Congestion Metrics.
Alarms
The box is empty while thes tatus of the BQN is being retrieved. A green "No Alarms" box means that every alarm is normal. Otherwise there is one row per raised alarm, the most severe first, yellow for notice and warning levels and red for critical (refer to the Troubleshooting section of the BQN User Manual). Click on a row to go to the related page:
- CPU: raised when CPU usage increases. Red means that toomany CPU cores are close to full. Status->System->CPU.
- Disk: raised when disk usage increases. Red means that the disk is close to full, not accessible or in read-only mode. Status->System->Disk.
- Memory dpdk,Memory pool: raised when the usage ofthe DPDK or the main memory pool increases. Status->System->Memory.
- Network Interfaces: status of the user traffic network interfaces (wires). Raised when some wire is not available,when wires are being configured or when no wires are configured. Status->Interfaces->Data Wires.
- Low Traffic, Downlink Traffic, Uplink Traffic: raised when the traffic is too low or when there is no traffic in one direction. Statistics->Throughput->Interfaces.
- Inverted Traffic: raised when the uplinktraffic exceeds the downlink traffic (a sign that one or more wires might be inverted, i.e. with the access side connected to the Internet). Statistics->Throughput->Interfaces.
- NTP: raised when no NTP servers are configured or none of the configured NTP servers are synchronized. Administration->SystemDate->NTP Servers.
- License Available, License Expiration, License Usage, License: raised when the license does not exist or is invalid, has expired, is approaching or exceeding its limit, or there is no connection with the license manager. Administration->License.
- Billing Sync: raised when a billing system is configured to provide subscriber information and the communication with the billing system fails. Status->Billing.
System Information
Just below the alarm box. Information provided:
- System Name: BQN server host name. Click to go to Administration->General Settings.
- BQN Release: BQN software package release. Click to go to Administration->Software.
- Hardware ID: internal hardware identifier. Click to go to Status->System->System Information.
- License Limit: license throughput capacity. Click to go to Administration->License.
- License Expiration: license expiration date (n/a if there is no license). Click to go to Administration->License.
- Start Time: time when the BQN processes were last started (year-month-day hour:minutes:seconds +offset from UTC). Click to go to Administration->Logs->System.
- System Time: current date and time of the BQN, with its timezone. Click to go to Administration->System Date->Set Date & Time.
TCP Speed &Acceleration
The percentage of TCP traffic currently subject to TCP optimization (TCPO), and a comparison overthe selected period of the average download speed of the TCP flows with (red dot) and without (grey dot) TCPO, for the network average and for the services with more traffic. The acceleration percentage is shown at the right of each row (n/s when it is not significant). Hover over a row to see both speeds.
Click on the title to go to Status->TCPOptimization.
DPI Statistics
Stacked chart of the throughput (downlink plus uplink, in Mbps) over the selected period of the application categories with more traffic, with the rest of the traffic grouped into one area of its own. When the traffic comes close to the license limit, a "LicenseLimit" line is drawn. Click on the colored dots of the legend to select or de-select a category.
Click on the title to go to Statistics->DPI Analysis->Hourly Volume per Application.
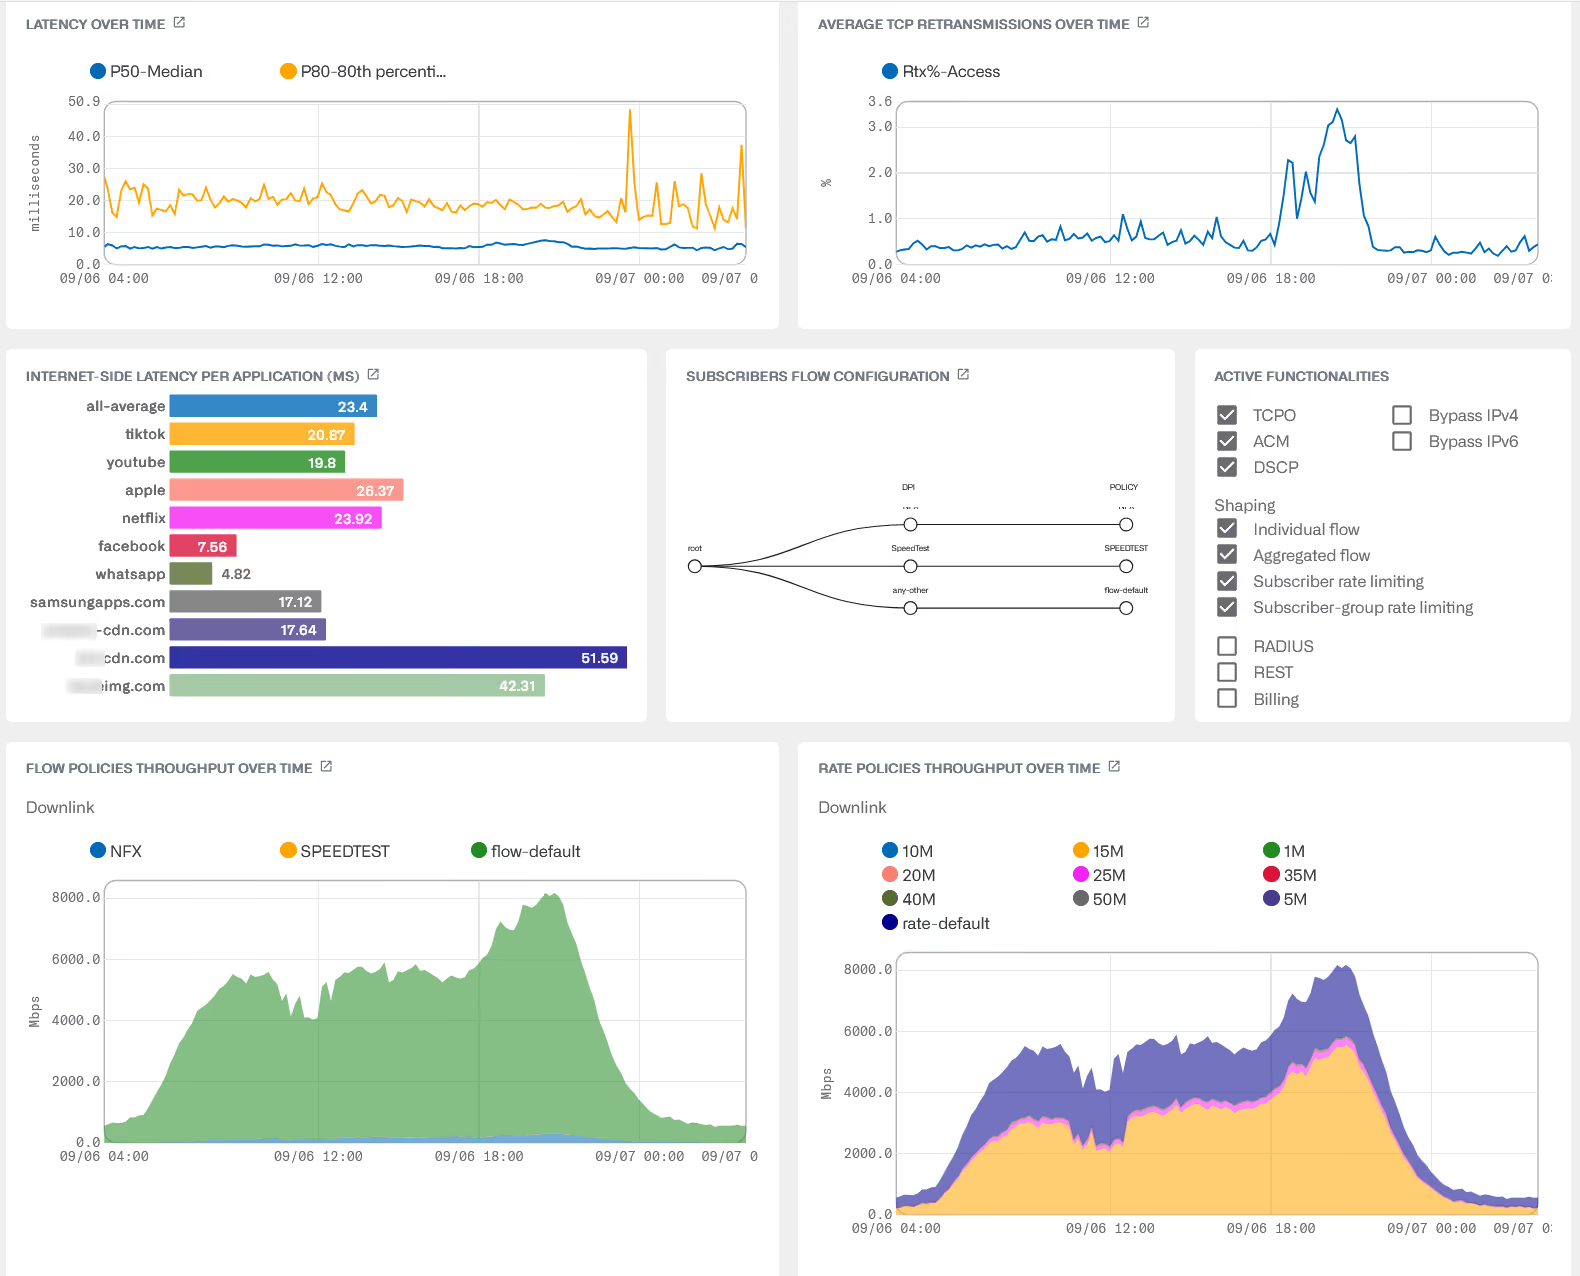
Latency Over Time
Round-trip latency measured from the BQN to the end users (downlink direction) over the selected period, in milliseconds: the median (P50) and the 80th percentile (P80) of the samples of every 5 minutes.
Click on the title to go to Statistics->System->Latency.
Average TCP Retransmissions Over Time
Percentage of TCP retransmissions on the access side over the selected period, which reflects packet losses towards the subscribers.
Click on the title to go to Statistics->System->Retransmissions.
Internet-side latency per application (ms)
Average round-trip time between the BQN and the Internet servers over the selected period, for the application categories with more traffic. Click on a bar to see the latency of that application in Statistics->DPI Analysis->Latency per Application,where the title leads too.
Subscribers Flow Configuration
Tree of the subscriber flow rules configured: the profiles matched and the flow policies they lead to. Click to go to Configuration->Subscriber Flows.
ActiveFunctionalities
A checked box means that the functionality is enabled. Click on any of them to go to its configuration page:
- TCPO, ACM,DSCP, Bypass IPv4, Bypass IPv6: Configuration->Optimization Settings.
- Shaping: individual flow shaping, aggregated (per subscriber) flow shaping, subscriber rate limiting and subscriber-group rate limiting. Configuration->OptimizationSettings.
- RADIUS: Configuration->RADIUS/REST/Billing->RADIUS.
- REST: Configuration->RADIUS/REST/Billing->REST API.
- Billing: checked when the BQN synchronizes its subscribers with a billing system, whose type is shown in parentheses. Configuration->RADIUS/REST/Billing->BillingSystems.
Flow Policies Throughput Over Time
Stacked chart of the downlink throughput (Mbps) of each flow policy over the selected period. The policies with more traffic are named, and the rest of them are grouped into one area. Click on the colored dots of the legend to select or de-select a policy.
Click on the title to go to Statistics->Throughput->Policies (flow policies).
Rate Policies Throughput Over Time
Same as the previous chart, for the rate policies. Click on the title to go to Statistics->Throughput->Policies (rate policies).
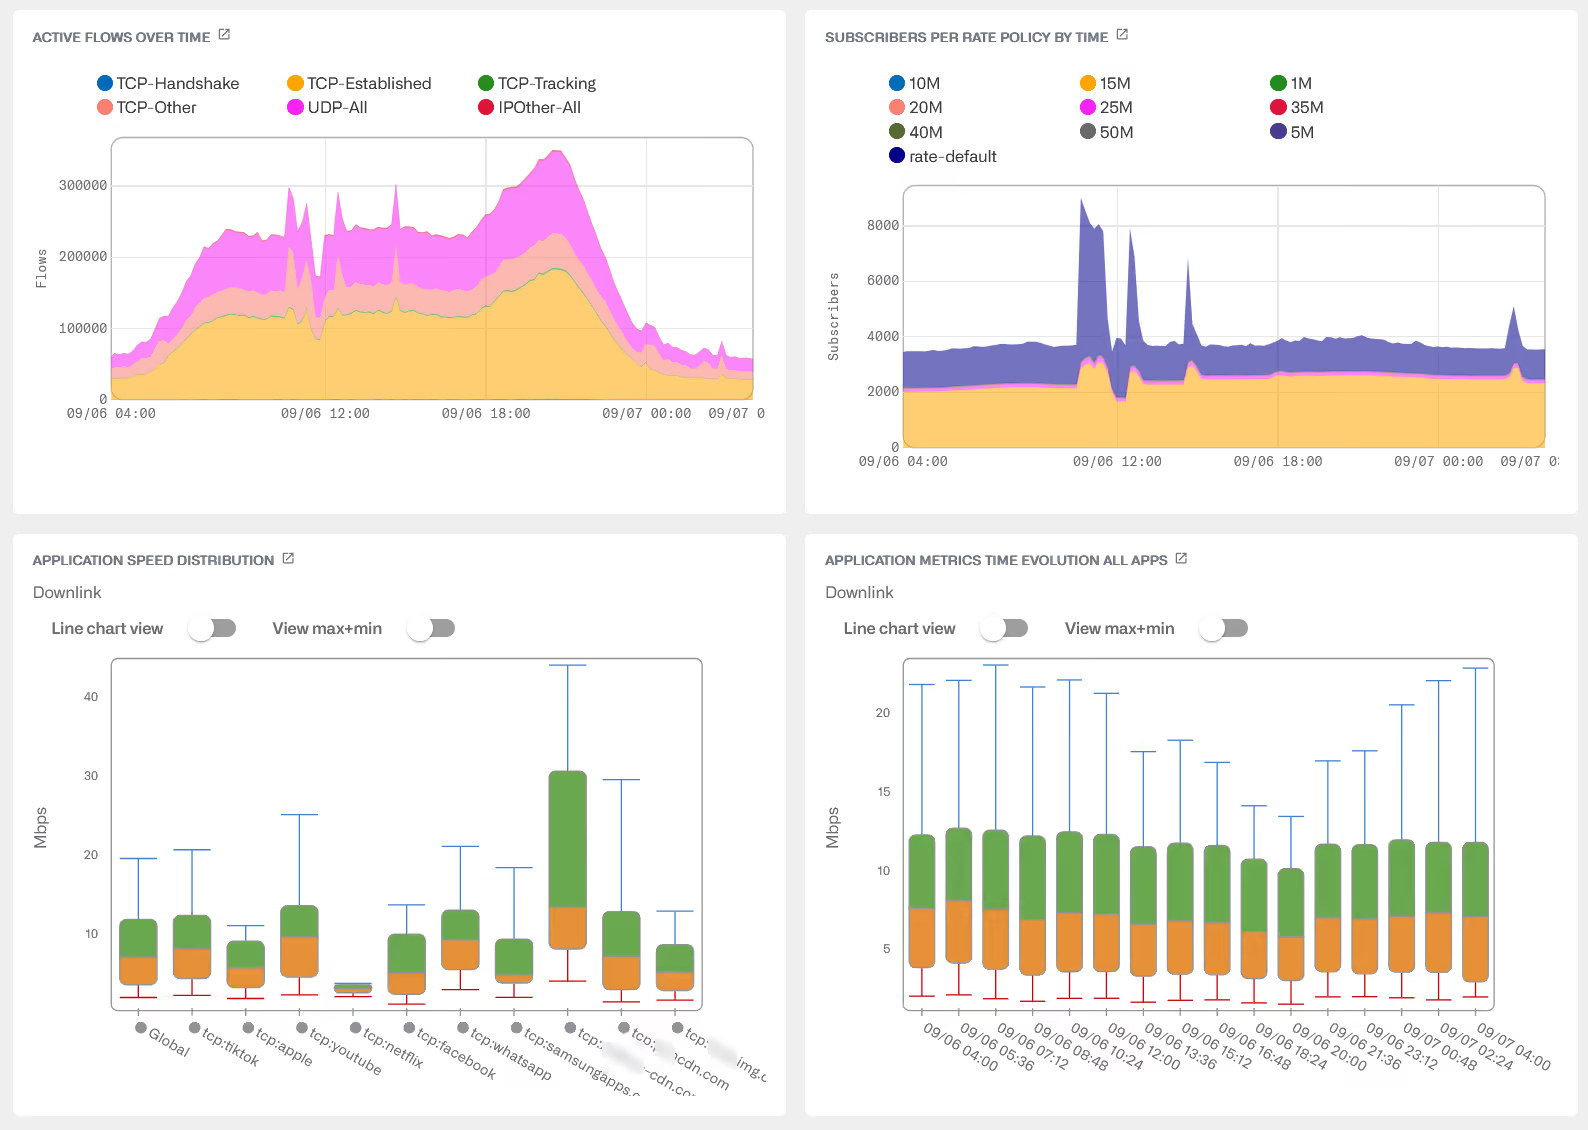
Active Flows OverTime
Stacked chart of the number of active flows per protocol over the selected period. Click on the title to go to Statistics->Flows->Per Protocol.
Subscribers per Rate Policy By Time
Stacked chart of the number of subscribers of each rate policy over the selected period. The policies with more subscribers are named, and the rest of them are grouped into one area.
Click on the title to go to Statistics->Subscribers->PerPolicy.
Application Speed Distribution
Distribution of the downlink flow speeds (Mbps) over the selected period of the applications with more traffic. A box plot summarizes the speed distribution: percentiles 10, 25, 50 (aka median), 75 and 90. The minimum and maximum values, hidden by default, can also be shown enabling the View max+min switch, and the Line chart view switch draws the percentiles as lines instead. Click on an application in the legend to select or de-select it.
Click on an application to see its metrics in Statistics->DPI Analysis->Application Speed Metrics, where the title leads too.
Application Metrics Time Evolution All Apps
Evolution over the selected period of the distribution of the downlink flow speeds (Mbps) of all the applications together, with one box per interval of time. The switches are the same as in the previous chart.
Click on the title to go to Statistics->DPIAnalysis->Application Speed Metrics.
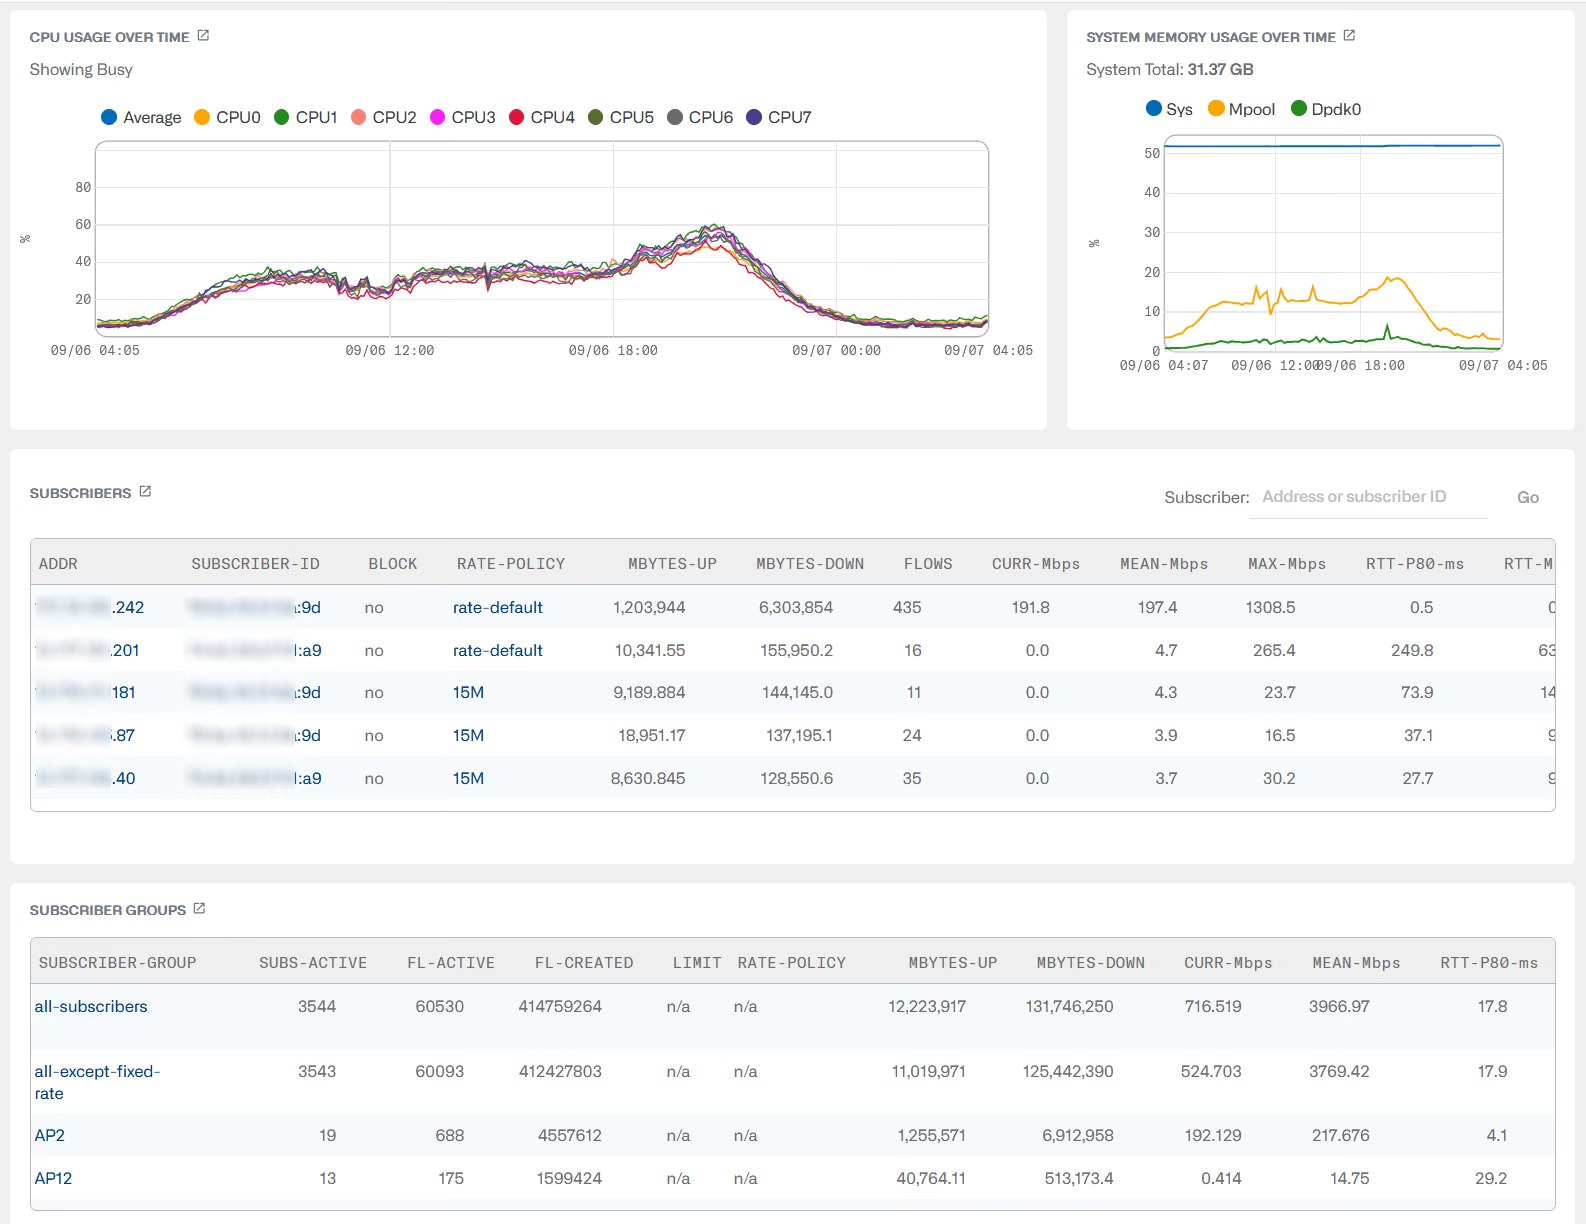
CPU Usage OverTime
Percentage of busy time of each CPU core over the selected period. Click on an item of the legend to show or hide its cores. When the BQN has many cores, the first ones are named and the rest of them share the last item of the legend.
Click on the title to go to Statistics->System->CPU.
System Memory Usage Over Time
Percentage of memory in use over the selected period: the system memory, the main memory pool (Mpool) and the DPDK pools. The total system memory is shown above the chart, and hovering over it shows the usage of each of them in percentage and in GB. When the whole cluster is selected, the totals are those of the BQN serving the GUI.
Click on the title to go to Statistics->System->Memory.
Subscribers
The 10 active subscribers with more downlink traffic. Click on the column headers to sort the table.
- Subscriber: type an IP address or a subscriber ID and press Enter (or click on Go) to open the dashboard of that subscriber.
- BQN (cluster only): the BQN serving the subscriber.
- ADDR: subscriber's IP address. Click to open the subscriber dashboard.
- SUBSCRIBER-ID: subscriber ID. Click to open the subscriber dashboard.
- BLOCK: blocking from billing configuration or quota.
- RATE-POLICY: name of the subscriber's rate policy. Click to see the policy (not available to users with the rates hidden).
- MBYTES-UP, MBYTES-DOWN: total traffic volume of this subscriber in each direction since it became active.
- FLOWS: number of currently active traffic flows (TCP connections, UDP or IP flows).
- CURR-Mbps: current speed in Mbps.
- MEAN-Mbps: moving average of the mean speed (calculated every 10 minutes) in Mbps.
- MAX-Mbps: maximum speed in Mbps during the previous 24 hours.
- RTT-P80-ms: the 80th percentile of all RTT latency samples, measured from the BQN to the end user, in 5 minutes.
- RTT-MED-ms: the 50th percentile (median) of all RTT latency samples, measured from the BQN to the end user, in 5 minutes.
- RTT-MIN-ms: the mean of all RTT minimum latency samples, measured in 1-second intervals, during active downloads, in 5 minutes.
- RTX: moving average of the percentage of TCP retransmissions (which reflect packet losses in this direction).
- MAX-SPEED-%: moving average of the percentage of traffic sent with a speed close to the maximum.
- CONGESTION: moving average of the percentage of traffic suffering congestion.
- WARN: number of warnings.
- LIFETIME: duration so far of this subscriber session.
Click on the title to go to Status->Subscribers->QoE Metrics.
Subscriber Groups
The 10 subscriber groups with more downlink traffic. Click on the column headers to sort the table.
- SUBSCRIBER-GROUP: name of the group. Click to open the subscriber group dashboard.
- SUBS-ACTIVE: active subscribers in the group. Click to see the QoE metrics of the subscribers in the group.
- FL-ACTIVE,FL-CREATED: active flows and flows created in the group.
- LIMIT: rate limit of the group (n/a if none, or when the user has the rates hidden).
- RATE-POLICY: name of the rate policy of the group (n/a if none). A warning icon indicates that the policy is not assigned by any rule. Click to see the policy (not available to users with the rates hidden).
- MBYTES-UP,MBYTES-DOWN: total traffic volume of the group in each direction.
- CURR-Mbps, MEAN-Mbps,
- RTT-P80-ms, RTT-MED-ms, RTT-MIN-ms, RTX, CONGESTION, WARN, LIFETIME: as in the Subscribers table, for the whole group.
- GROUP-TYPE: type of the subscriber group.
Click on the title to go to Status->Subscribers->Subscriber Groups.
AI Assistant
From R5.0, the GUI includes an Artificial Intelligence assistant. Click on the menu option or the icon on the lower right.
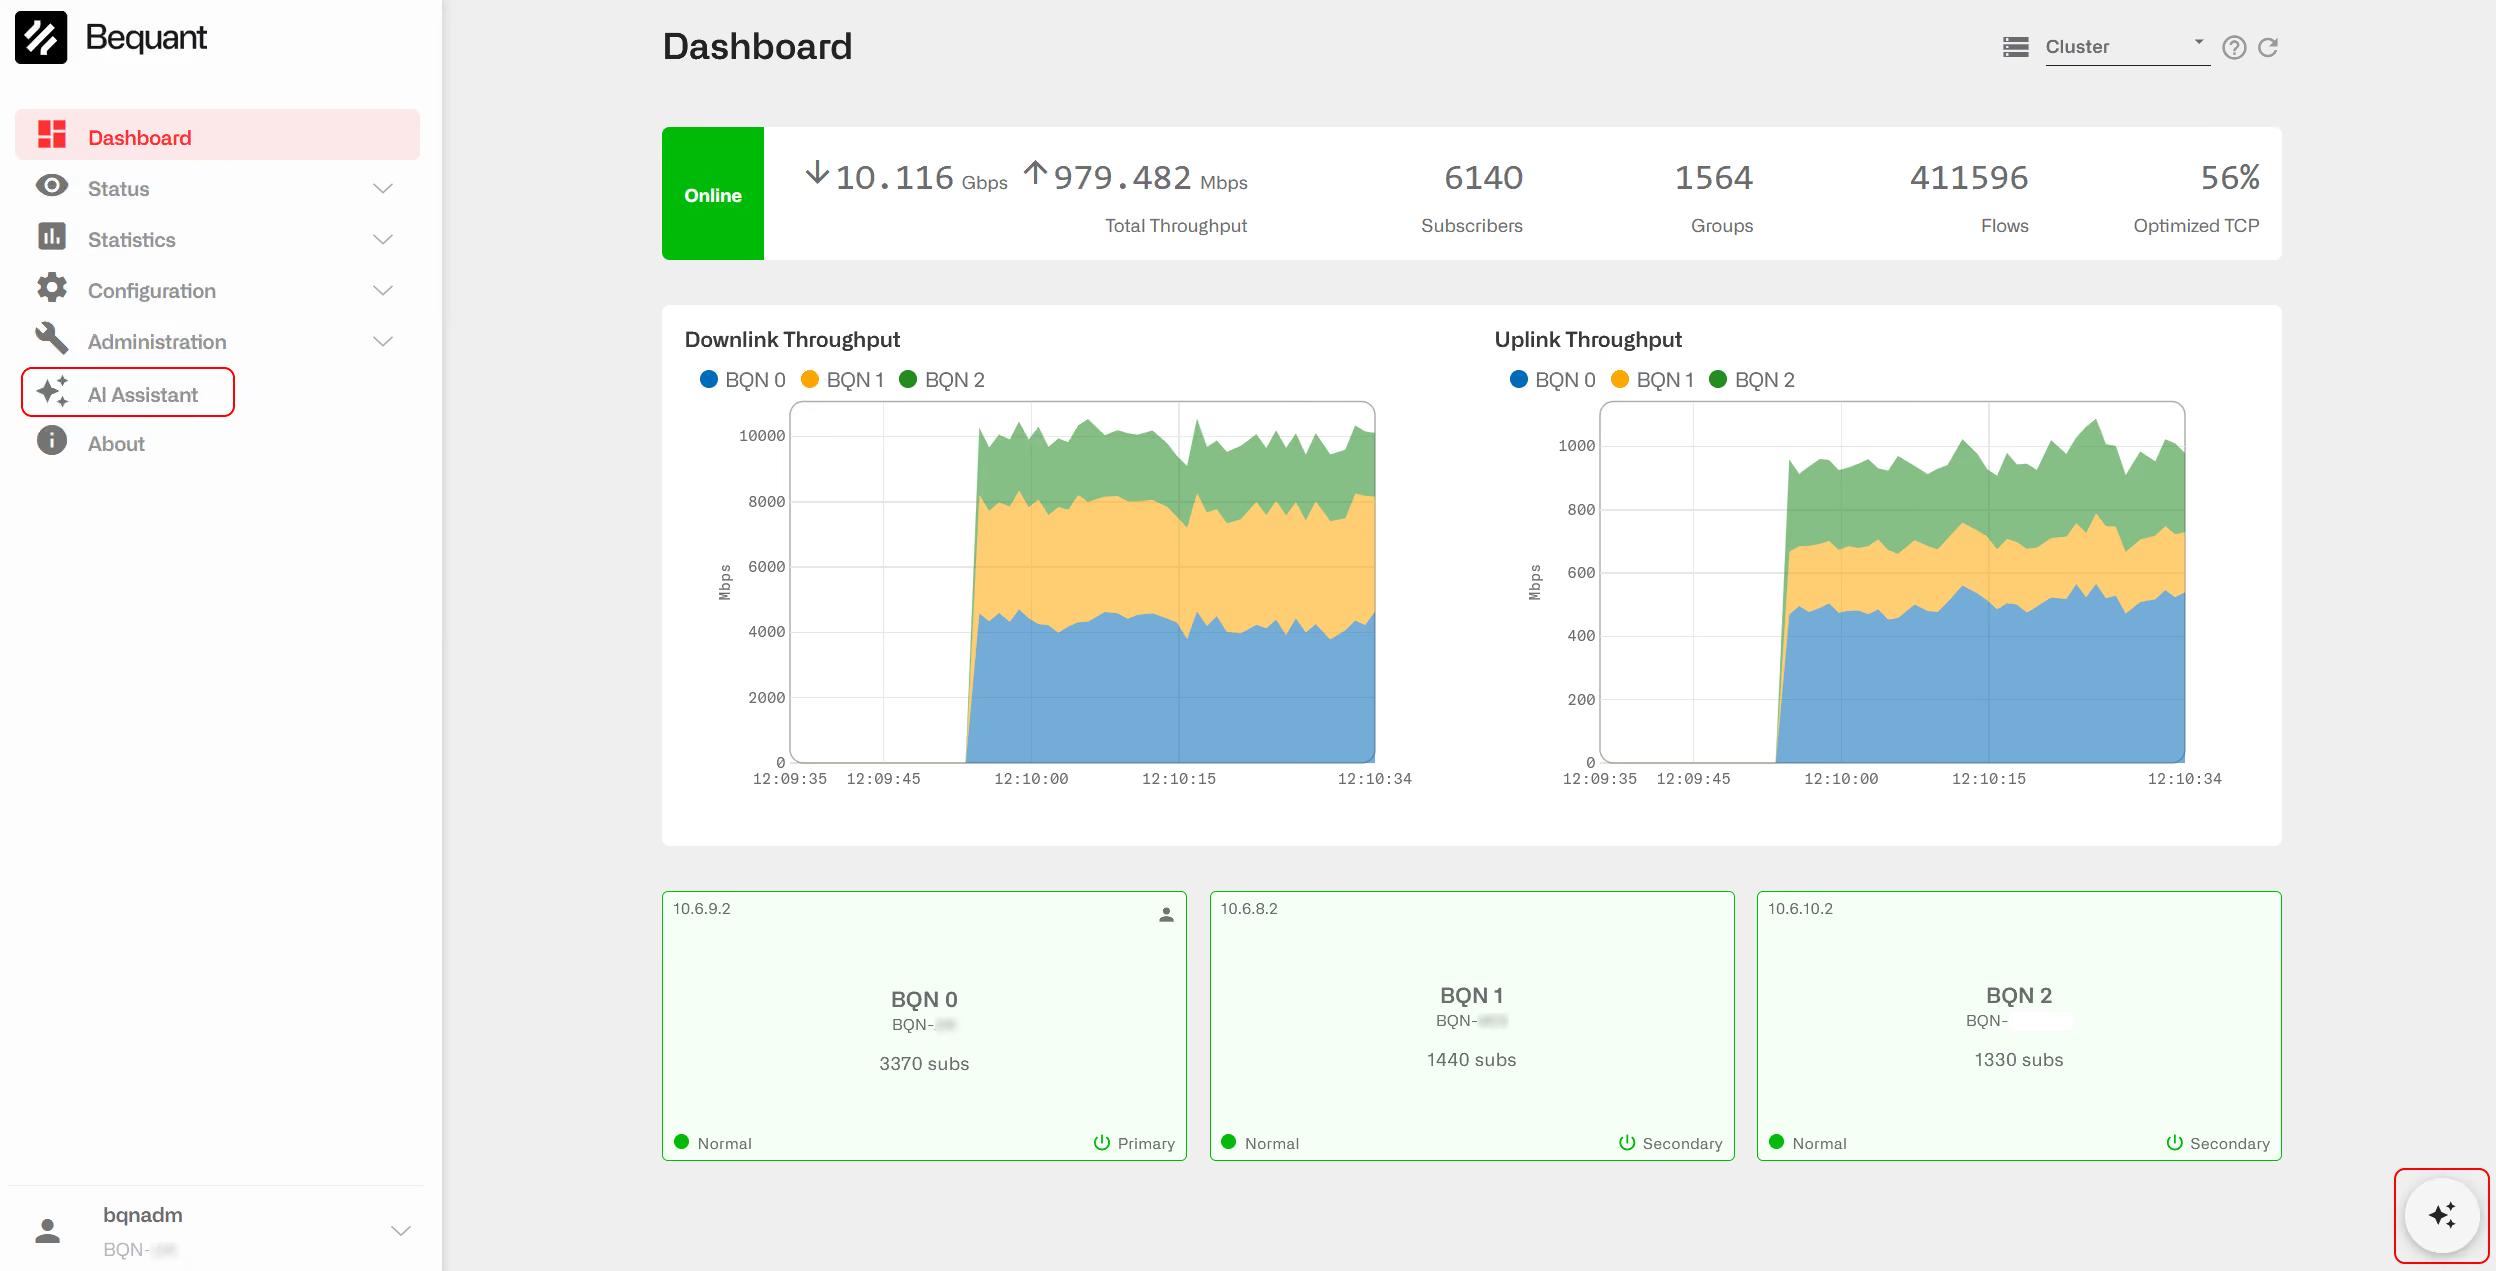
A dialogue is shown, where you can type your question. The AI assistant will compose a response, including links to the online documentation or BQN own GUI pages, when applicable.
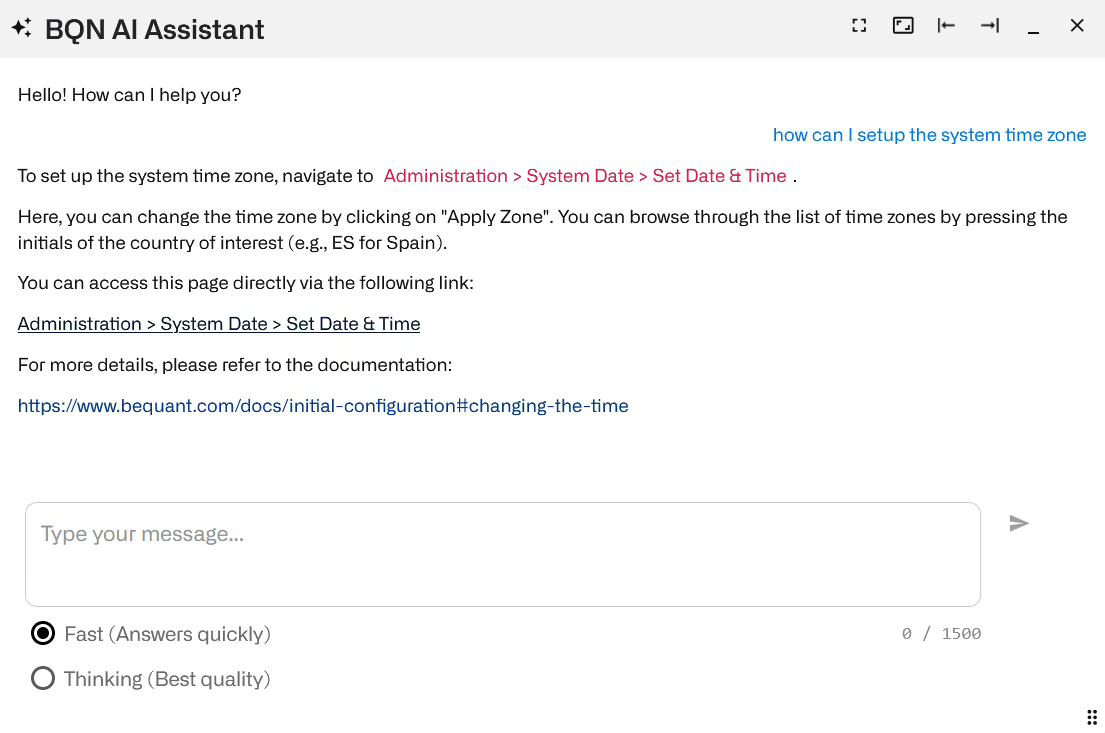
You can decide between a fast model or one that will take more time but will respond with a more thorough answer. In the upper right corner, you can maximize the dialogue, place it to the left of to the right, minimizei t or close it completely.
Tables
Many GUI pages contain data tables to display information. The following picture provides an example.
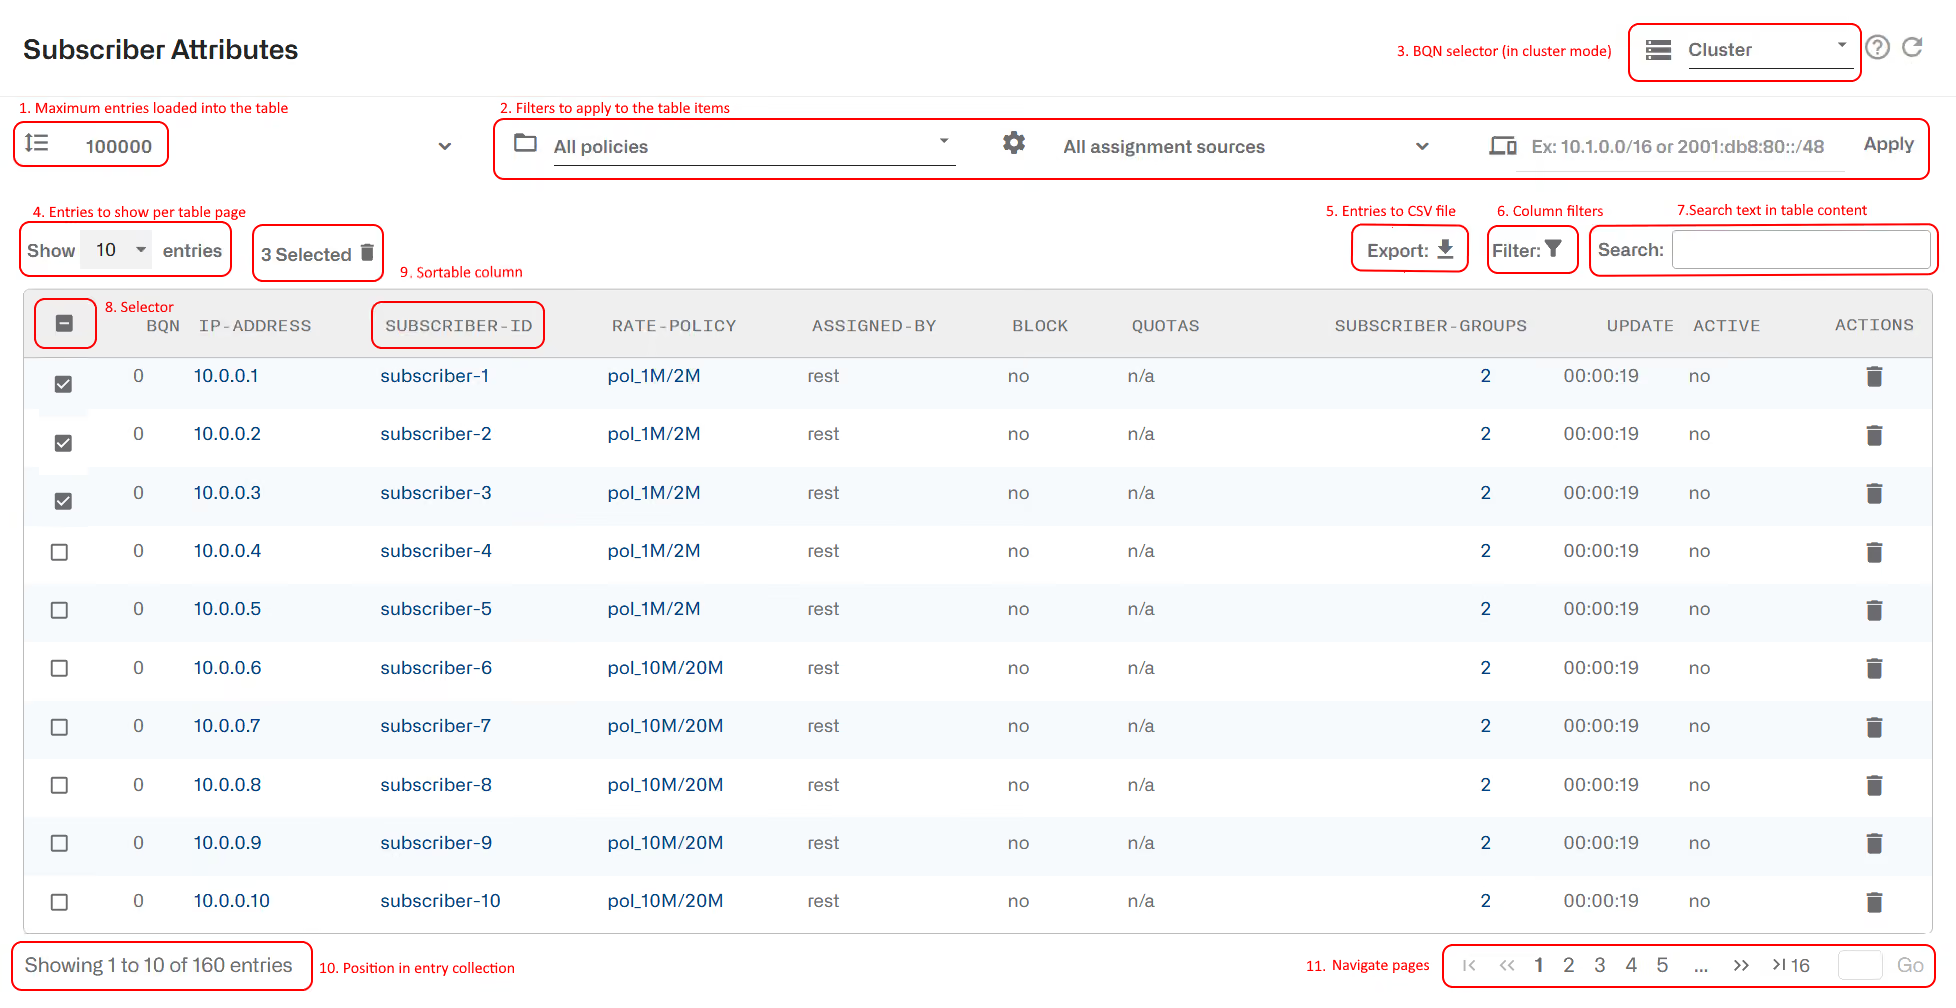
We have highlighted in red the most important features:
- The first selector on the upper left defines how many entries to load in the table (10,000 in the example). The default value of each table is chosen to load all entries in normal circumstances. If the default is too low, a bigger number can be selected here.
- To the right of the total entries, there are several elements to filter the table content. In the example above, entries can be filtered by policy, source and by subscriber.
- If cluster is configured, this element shows all entries in cluster or just entries of one specific server in the cluster.
- The “show entries” define the page size.
- The Export button generates a CVS file with the table content. The file has a first row with the column labels and then one line per table row.
- The filter defines filtering criteria based on a column value (more on this below).
- The search field shows the table entries containing the substring specified in the text field.
- Selector. Multiple rows can be selected and an operation applied to all of them (in the example, above, clicking in the delete icon of the selected summary at the top of the table).
- Columns with arrows are sortable. To sort by a column, click on that column label. Clicking again will use reversed ordering.
- A label on the lower left informs about where we are in the list of entries.
- The buttons on the lower right navigate along the table pages. You can go to the first page, to the last page, to the next or to the previous pages. To go to a specific page, click its number or type the page number on the Go field and press enter.
Table Export
When exporting tables to CVS, because a comma has special meaning, commands are scaped as follows:
- If a field contains a comma(“,”) the whole field is enclosed in double quotes. For example: a,b is exported as “a,b".
- If a field contains one double quote, it is replaced by two double quotes. For example: a”b is exported as a””b.
- If both a comma and a double quote is present, both rules are applied. For example, “a,b” is exported as “””a,b”””.
Table Column Filter
You can filter the elements shown in the table. Click on Filter:
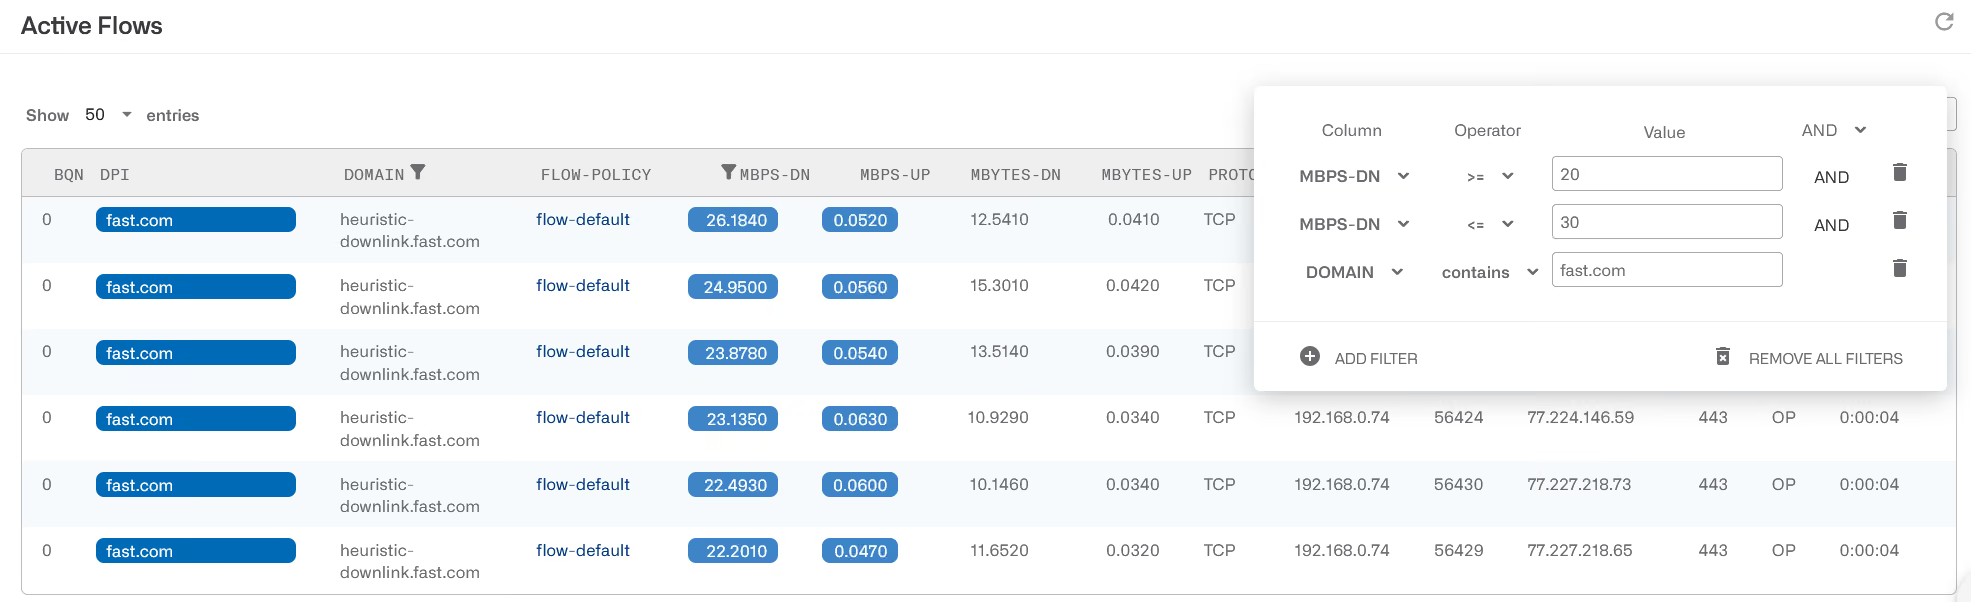
A dialogue appears where the filter can be defined:
- Select the table column where to apply the filter (MPBS-DN in this example).
- Select the operation to use in relation with the value. For a numerical value, the possibilities are: equal (=), less than(<), less or equal than (<=), more or equal than (>=), more than (>) and not equal (!=). In this example, we select >=.
- Type the value.
You can define several filters at the same time, to the same or to different columns, and decide if all must be met (AND option) or at least one (OR option). In the example, we have defined two filters on MBPS-DN column to select flows whose downlink speed is between 30 and 35 Mbps and a filter on DPI column to select only those containing “fast.com” string, all combined with ANDs.
Changing the Time
If it is necessary to change the system time, go to Administration->System Date->Set Date & Time.
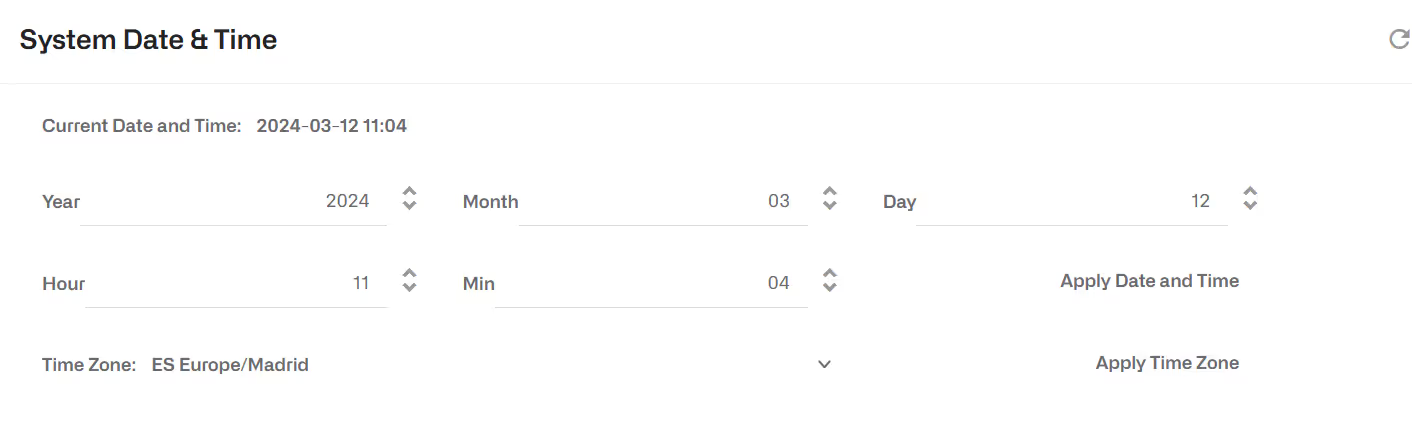
Apply Date changes the local date and time, and Apply Zone changes the time zone. It is possible to browse through the list of time zones pressing the initials of the country of Interest (e.g., ES for Spain).
Changing the Management IP Address
To change the settings of the management interface, select on the lateral menu Configuration->Interfaces->Management. IP settings include the IP address and mask, the default gateway and the VLAN identifier (if any).
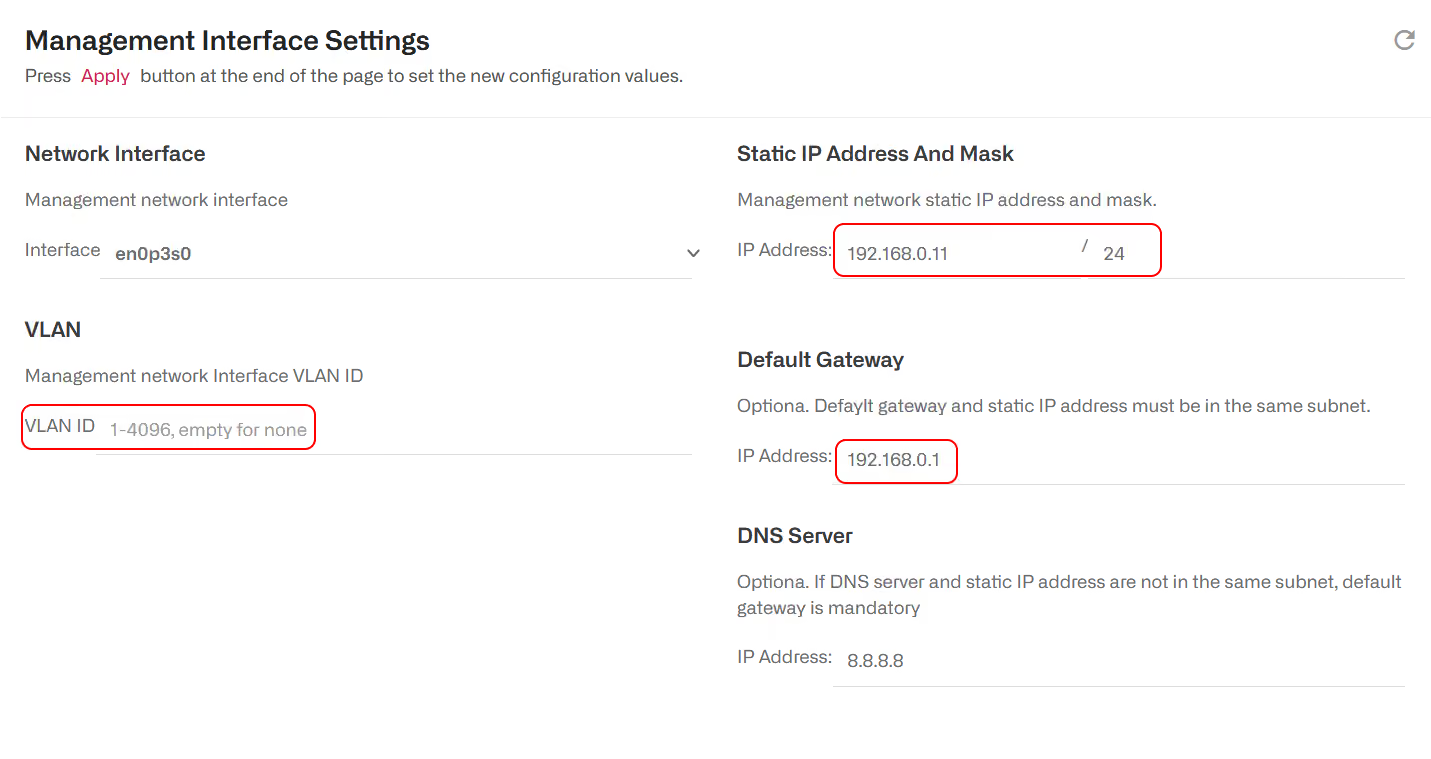
The network Interface used for management must not be changed, unless indicated by the Bequant support personnel.
When the new settings are completed, press Apply Configuration to commit the changes. Connecting back to the node may require access from the new subnet and logging back into the GUI.
DNS Configuration
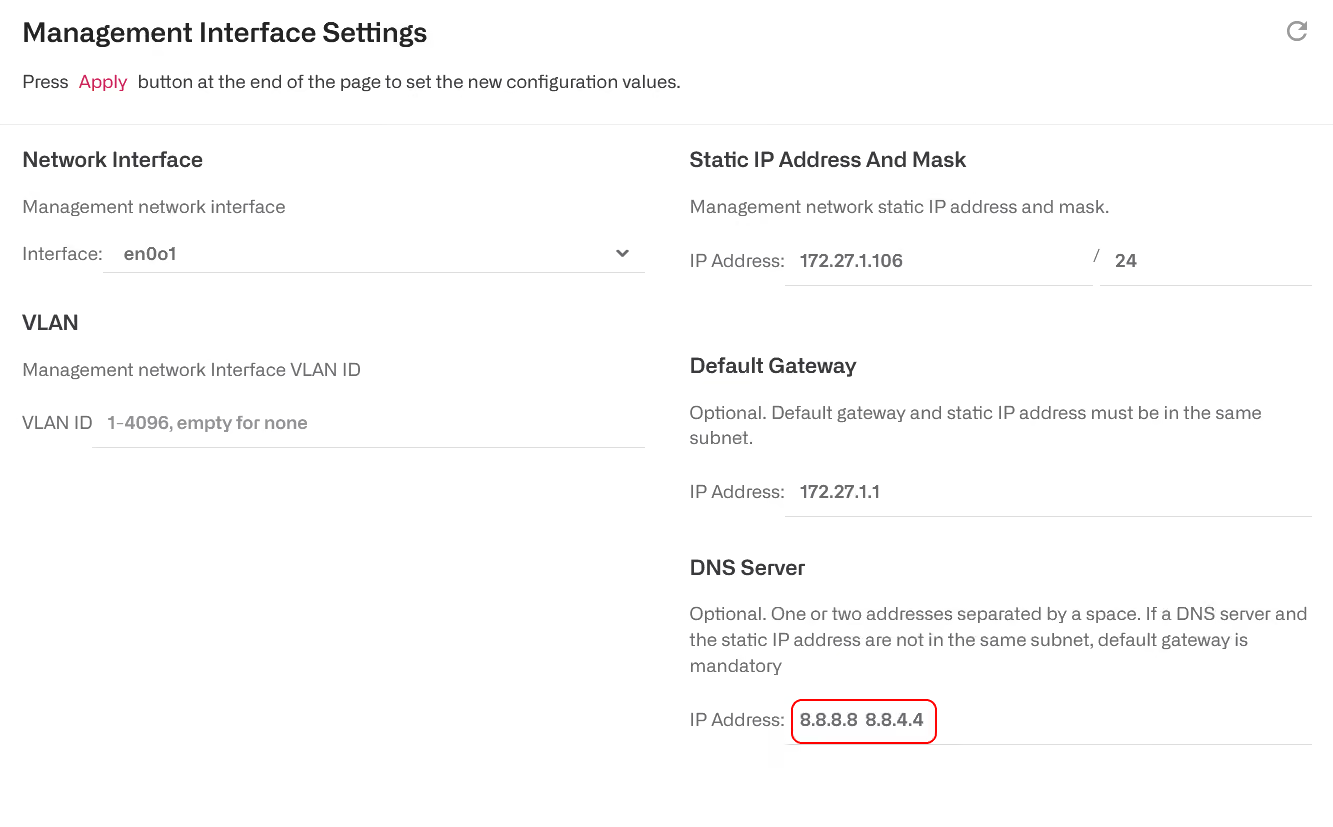
To configure a DNS server, go to Configuration->Interfaces->Management and fill the DNS Server field.
DNS server is mandatory if a billing system is configured with a server name instead of its IP address.
A secondary DNS server can be configured right after the primar yone.
Wire Configuration
A wire is a network interface pair processing subscriber traffic.
To configure wires, select Configuration->Interfaces->Data Wires.
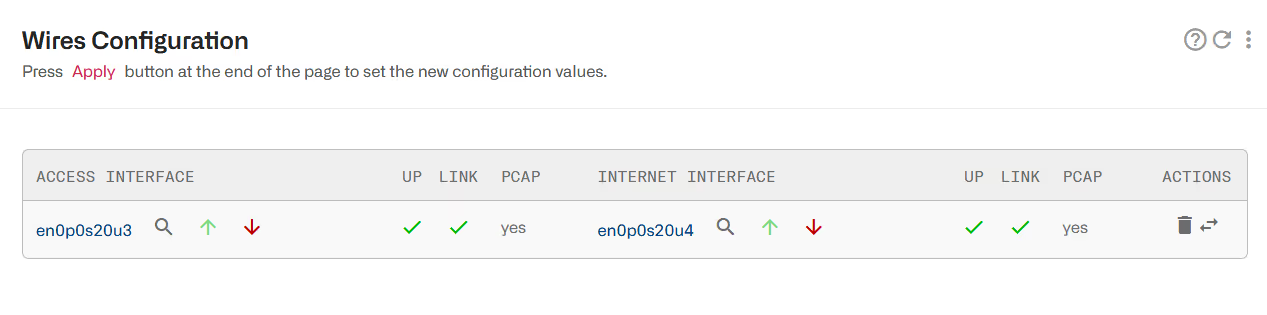
Wires are directional, with the first network interface connected to the access towards the subscribers and the second interface on the Internet side. If a mistake has been made in connecting the ports, they can be swapped clicking on the ⇄ arrows icon.
To add a wire, click on the ⁝ menu icon and select Add Wire…. A form will allow you to select the access and Internet interfaces (the form will list the interfaces available). The pcap option is selected only for cards other than Intel (pcap allows compatibility at the price of reducing server performance). Exceptionally, the pcap node may be required to make the interface visible to the operating system during maintenance tasks (e.g. during a card firmware update).
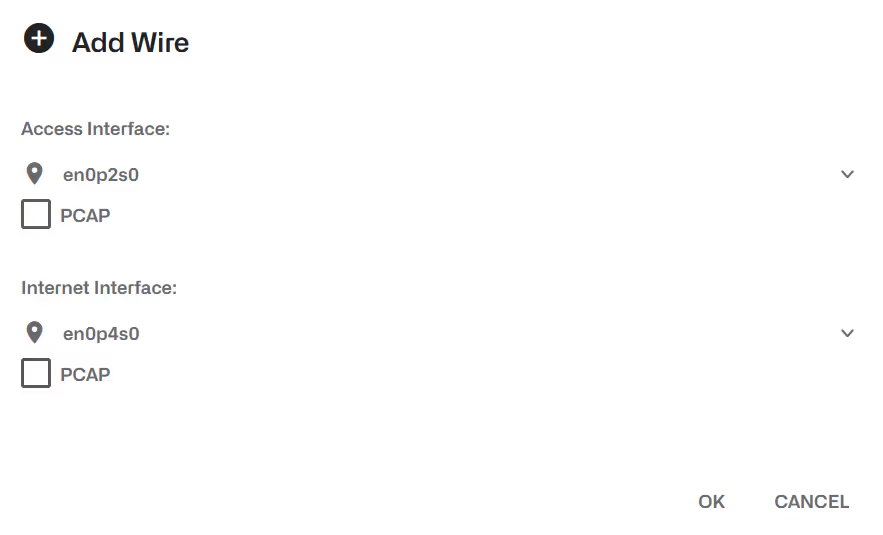
To remove a wire, press the trash can icon. To modify a wire (for example, to enable the pcap option), you have to remove the existing wire and then, before applying the changes, add the wire with the change.
Wires should not be deleted unless indicated by the Bequant support personnel, as misconfigurations may lead to service loss.
Changes only apply after clicking Apply Configuration.
To force a reconnect of the network port, you can disable it clicking on the red downwards arrow next to the interface name and enable it again by clicking on the green upwards arrow. Please note that traffic will be interrupted while the interface is disabled and that enabling it may take a while in some systems.
IPMI Configuration
Some servers have a lights-out module for general management (power on/off, hardware monitoring, etc). We recommend using the server own setting tools (e.g. BIOS section), but if this is not possible (e.g. the server is already powered and with traffic), the BQN CLI allows a basic setup.
To do it, access to the BQN shell is needed.The following example sets a static IP address 192.168.0.120/24 with default gateway 192.168.0.1 and creates a new user bequant.
Remote Access using Port Forwarding
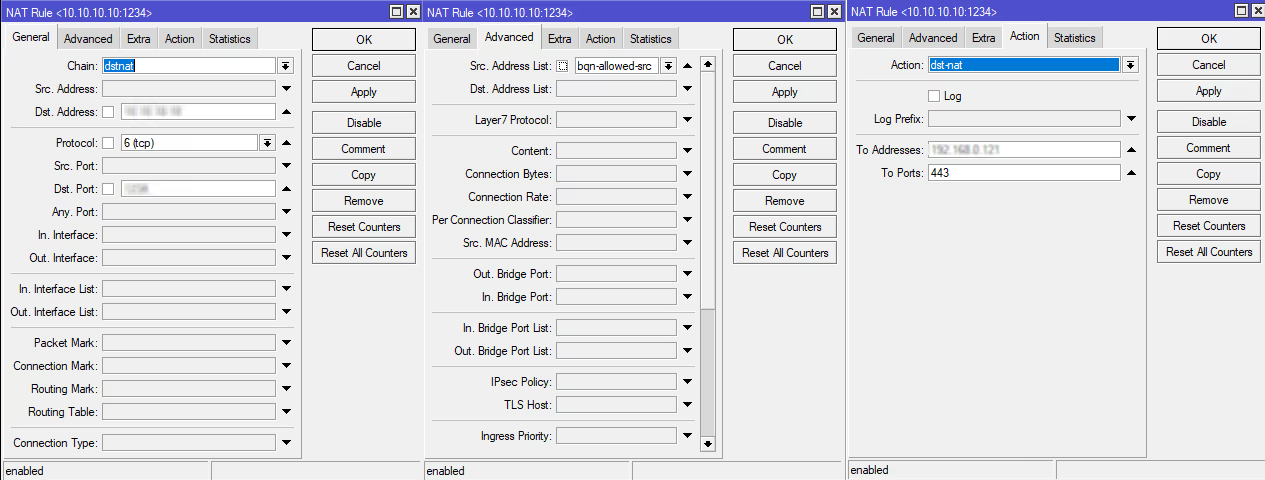
To allow access from the Internet to the BQN server in a secure way, a port forwarding rule should be configured, restricted to only a small set of source IP addresses. The rest of the section describes the steps to follow in a Mikrotik router to do port forwarding of HTTPS (port 443). Similar steps can be followed for SSH (port 22).
Go to IP->Firewall->Address Lists and create an address list with all the source IP addresses that will be allowed access to the BQN server (in our example, we call it bqn-allowed-src).
In IP->Firewall->NAT, create a destination NAT rule:
- In the General tab, Chain is set to dstnat.
- In the General tab, Dst. Address is set to the public IP address used to access the BQN from the Internet.
- In the General tab, Protocol is set to TCP.
- In the General tab, Dst. Port is set to the public IP address used to access the BQN from the Internet.
- In the Advanced tab, Src. Address List is set to the name of the previously created list (bqn-allowed-src inour example).
- In the Action tab, set Action to dst-nat.
- In the Action tab, set To Address to the IP address of the BQN server (for example, 192.168.0.121).
- In the Action tab, set To Ports to 443, the HTTPS port of the BQN server.
Initial policy configuration
This is an optional step. You can load an initial policy configuration with recommended traffic rules. See Sample set of flow policy rules for details.
Lorem ipsum dolor sit amet, consectetur adipiscing elit. Suspendisse varius enim in eros elementum tristique. Duis cursus, mi quis viverra ornare, eros dolor interdum nulla, ut commodo diam libero vitae erat. Aenean faucibus nibh et justo cursus id rutrum lorem imperdiet. Nunc ut sem vitae risus tristique posuere.
Lorem ipsum dolor sit amet, consectetur adipiscing elit. Suspendisse varius enim in eros elementum tristique. Duis cursus, mi quis viverra ornare, eros dolor interdum nulla, ut commodo diam libero vitae erat. Aenean faucibus nibh et justo cursus id rutrum lorem imperdiet. Nunc ut sem vitae risus tristique posuere.
Lorem ipsum dolor sit amet, consectetur adipiscing elit. Suspendisse varius enim in eros elementum tristique. Duis cursus, mi quis viverra ornare, eros dolor interdum nulla, ut commodo diam libero vitae erat. Aenean faucibus nibh et justo cursus id rutrum lorem imperdiet. Nunc ut sem vitae risus tristique posuere.