
Introduction
Starting with R5.0, several BQN servers can be associated into one cluster. The cluster covers management aspects: common rule configuration, common software updates and common visibility from either of the servers forming the cluster.
Logging into any of the servers in the cluster:
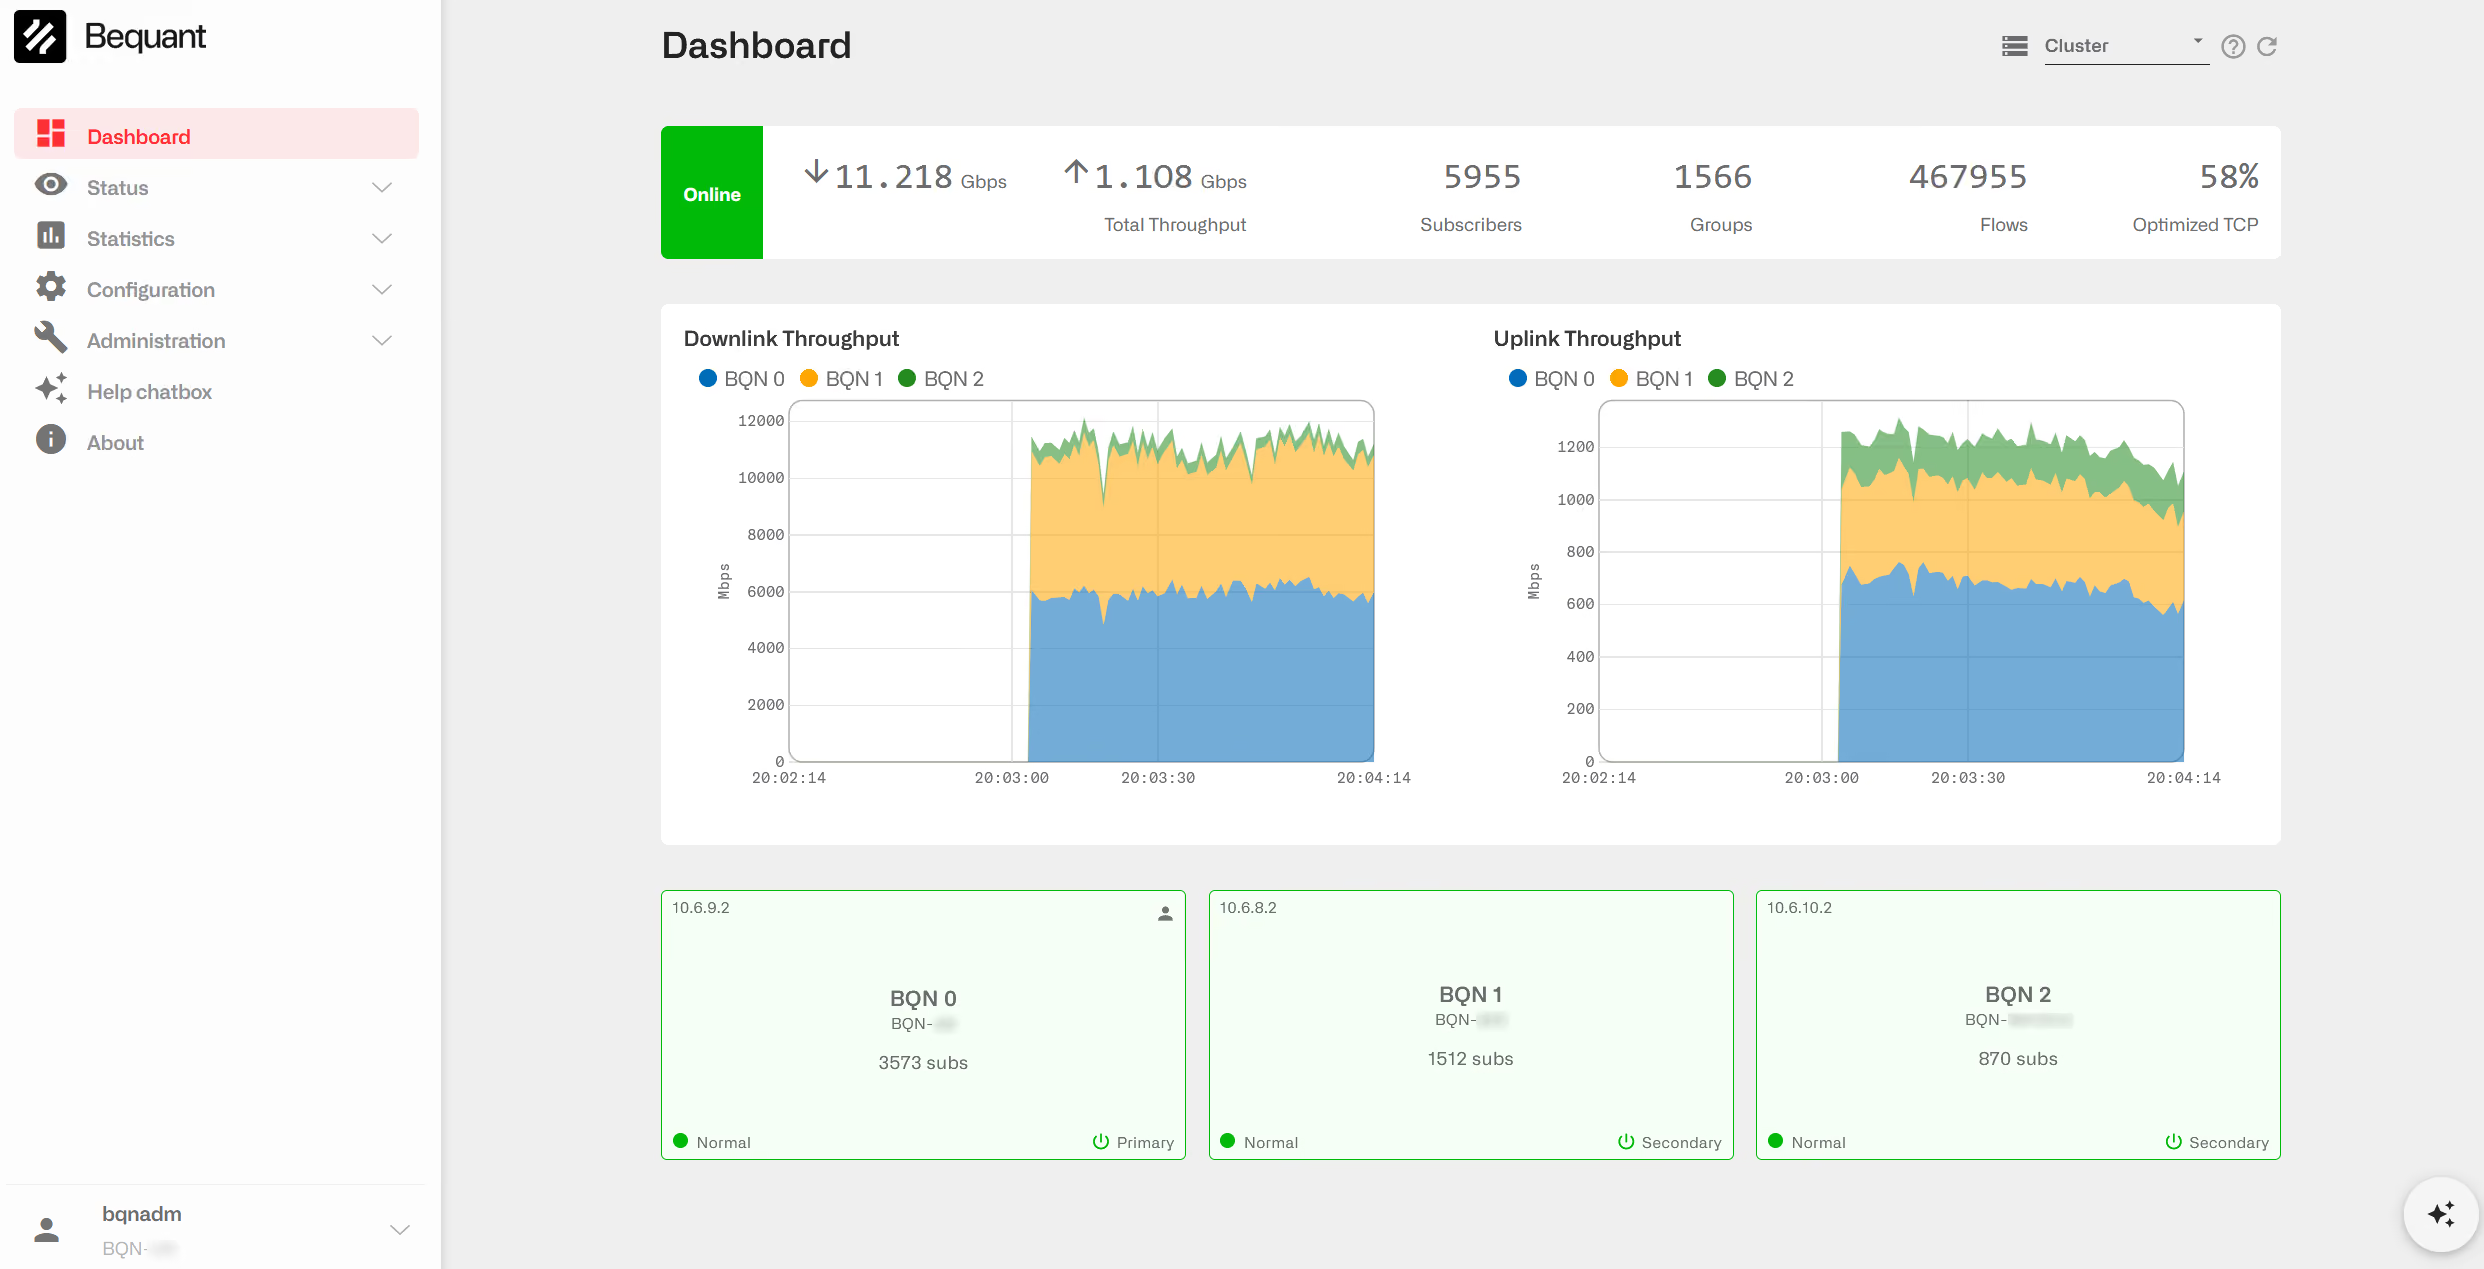
New Cluster Dashboard
Shows the overall status of the cluster: whether every BQNis online, the alarms and load of each of them, the traffic the whole cluster is passing right now and the evolution over the selected period of the main system, subscriber and application metrics, aggregated for all the BQNs.
This page is the dashboard shown when "All" isselected in the BQN selector of the upper right. Click on a BQN of the BQNs panel to open the dashboard of that BQN alone, whose back arrow returns here.If the BQN shown there goes offline, its dashboard switches back to this one.
Most panels are links. Click on a panel title marked with the launch icon to open the page with the full information, and on a value to open the page it comes from. The pages opened this way have a back button that returns to the cluster dashboard, and the ones showing an evolution over time open with the period selected here.
Selectors:
- Last 1d / 2d / 3d / 7d: the periodcovered by the charts and tables that show an evolution over time (last 24hours, 2, 3 or 7 days).
- (HELP): opens the help.
- (REFRESH): reloads every panel and restarts the live throughput charts. Without it, the live values (throughput, latency, retransmissions, subscribers, groups and flows) refresh every 2 seconds, the cluster status and the alarms of the BQN severy 4 seconds, and the charts and tables every 5 minutes. Nothing isr efreshed while the browser tab is hidden.
A panel shows "n/a" while its data has not arrived yet, and "No data available" when the cluster reports nothing for the selected period.
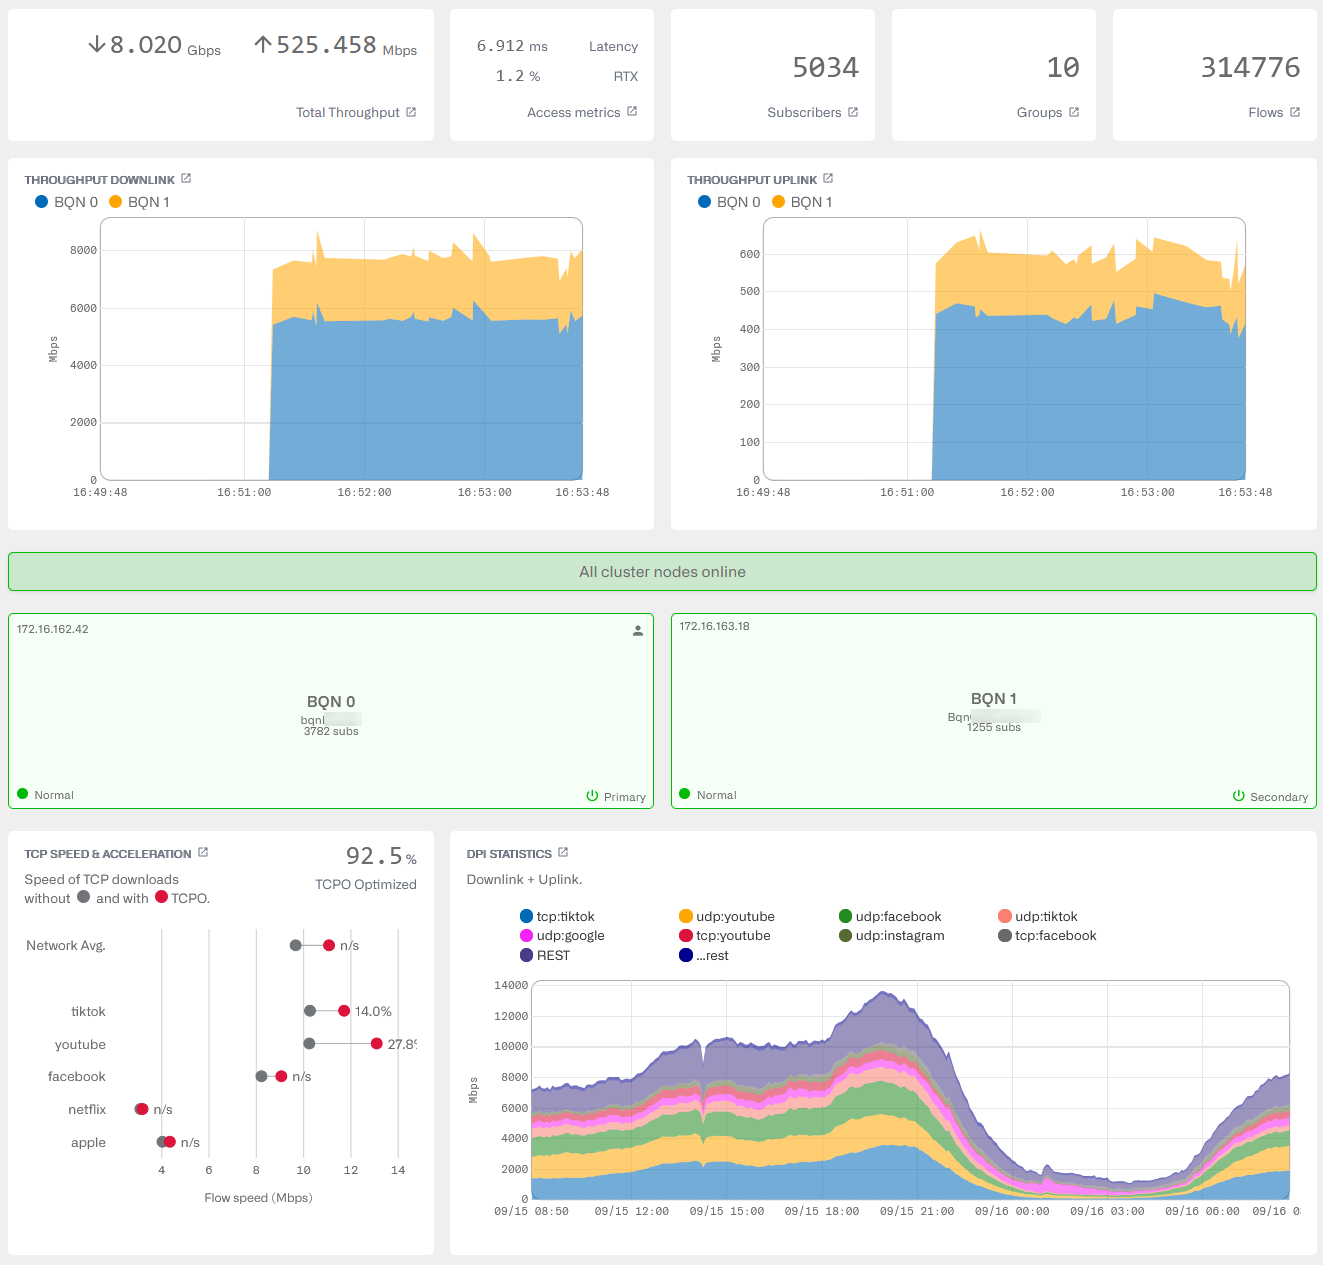
Total Throughput
Current downlink (down arrow) and uplink (up arrow) throughput of the whole cluster, in Mbps (Gbps when above 1000 Mbps), adding up the traffic of every BQN. They are computed from two consecutive samples, so 0 is shown until the second one arrives.
Click on a throughput value to go to Statistics->Congestion Metrics, and on the panel title to go to Statistics->Throughput->Live Subscribers.
Access metrics
- Latency: median round-trip time, in the last interval, between the BQNs and the subscribers (access side, downlink direction), for the whole cluster. Click to go to Statistics->System->Latency.
- RTX: percentage of TCP retransmissions on the access side in the last seconds, for the whole cluster, which reflects packet losses towards the subscribers. Click to go to Statistics->System->Retransmissions.
Click on the panel title to go to Statistics->CongestionMetrics.
Subscribers, Groups and Flows
- Subscribers: active subscribers in thewhole cluster (one access IP address counted as one subscriber). Click to go to Status->Subscribers->QoE Metrics.
- Groups: active subscriber groups. Click to go to Status->Subscribers->Subscriber Groups.
- Flows: active flows in the whole cluster(TCP connections, UDP flows and other IP protocol flows). Click to go to Status->Flows->Details.
Throughput Downlink and Throughput Uplink
Live charts of the throughput of the last minutes in each direction, in Mbps, sampled every 2 seconds, with one area per BQN stacked over the others so that the top of the chart is the throughput of the whole cluster. The chart starts with the last minute and widens as the samples arrive, up to10 minutes.
- Hover over the chart to see the time and thethroughput of every BQN at that moment.
- In the legend, click on a BQN to hide or show it, double-click on it to show only that BQN, and click on the only BQN shown to show all of them again. The selection applies to both directions.
- Right-click on a BQN, in the legend or on its area of the chart, to open the dashboard of that BQN.
Click on a panel title to go to Statistics->Throughput->Live Subscribers in that direction.
Cluster status
A green "All cluster nodes online" bar means that every BQN of the cluster is online. A yellow "Some cluster nodes offline" bar means that at least one of them is not. Click on the bar to go to Administration->Cluster.
BQNs
One button per BQN of the cluster, showing its IP address, its BQN identifier and host name, its number of active subscribers, its alarm status and its role in the cluster. A person icon marks the BQN serving this GUI.
The alarm status is normal, warning or critical, according to the most severe alarm raised in that BQN (refer to the Troubleshooting section of the BQN User Manual). Hover over the status to see the list of alarms and their levels. An offline BQN is shown disabled, with no status.
Click on a BQN to open its dashboard, where the panels below show the metrics of that BQN alone.
TCP Speed & Acceleration
The percentage of TCP traffic of the whole cluster currently subject to TCP optimization (TCPO Optimized), and a comparison over the selected period of the average download speed of the TCP flows with (red dot) and without (grey dot) TCPO, for the network average and for the services with more traffic. The acceleration percentage is shown at the right of each row( n/s when it is not significant). Hover over a row to see both speeds.
Click on the title to go to Status->TCP Optimization.
DPI Statistics
Stacked chart of the throughput of the whole cluster (downlink plus uplink, in Mbps) over the selected period of the application categories with more traffic, with the rest of the traffic grouped into one area of its own. Click on the colored dots of the legend to select or de-selecta category.
Click on the title to go to Statistics->DPI Analysis->Hourly Volume per Application.
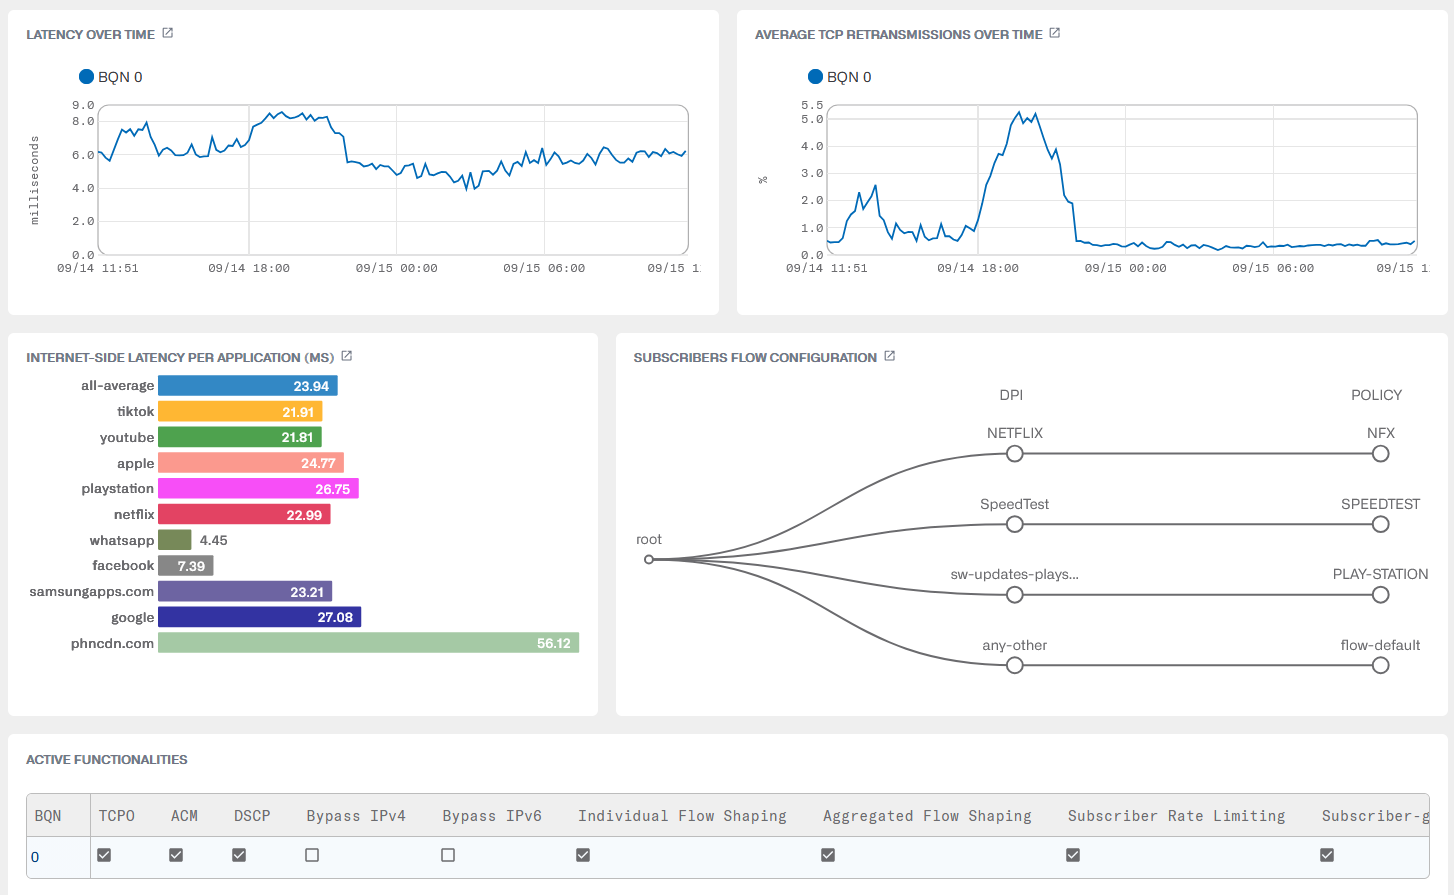
Latency Over Time
Round-trip latency measured from each BQN to its end users (downlink direction) over the selected period, in milliseconds, with one line per BQN: the median (P50) of the samples of every 5 minutes.
Click on the title to go to Statistics->System->Latency.
Average TCP Retransmissions Over Time
Percentage of TCP retransmissions on the access side of each BQN over the selected period, with one line per BQN, which reflects packet losses towards the subscribers of that BQN.
Click on the title to go to Statistics->System->Retransmissions.
Internet-side latency per application (ms)
Average round-trip time between the cluster and the Internet servers over the selected period, for the application categories with more traffic. Click on a bar to see the latency of that application in Statistics->DPI Analysis->Latency per Application, where the title leads too.
Subscribers Flow Configuration
Tree of the subscriber flow rules configured in the cluster: the profiles matched and the flow policies they lead to. Click to go to Configuration->Subscriber Flows.
Active Functionalities
One row per BQN online, with a checked box for each functionality enabled in that BQN and "n/a" for the ones the BQN did not report. Click on the column headers to sort the table, and on the BQN identifier to open the dashboard of that BQN. Click on any other cell to go to the configuration page of that functionality, with that BQN selected:
- TCPO, ACM, DSCP, Bypass IPv4, Bypass IPv6: Configuration->Optimization Settings.
- Individual Flow Shaping, Aggregated FlowShaping, Subscriber Rate Limiting, Subscriber-group Rate Limiting: Configuration->Optimization Settings.
- RADIUS: Configuration->RADIUS/REST/Billing->RADIUS. The RADIUS API is configuredfor the whole cluster, so every BQN shows the same state.
- REST: Configuration->RADIUS/REST/Billing->REST API. The REST API is served by the cluster, so every BQN shows the same state.
- Billing: checked when the BQN synchronizes its subscribers with a billing system, whose type is shown next tothe box. Configuration->RADIUS/REST/Billing->Billing Systems.
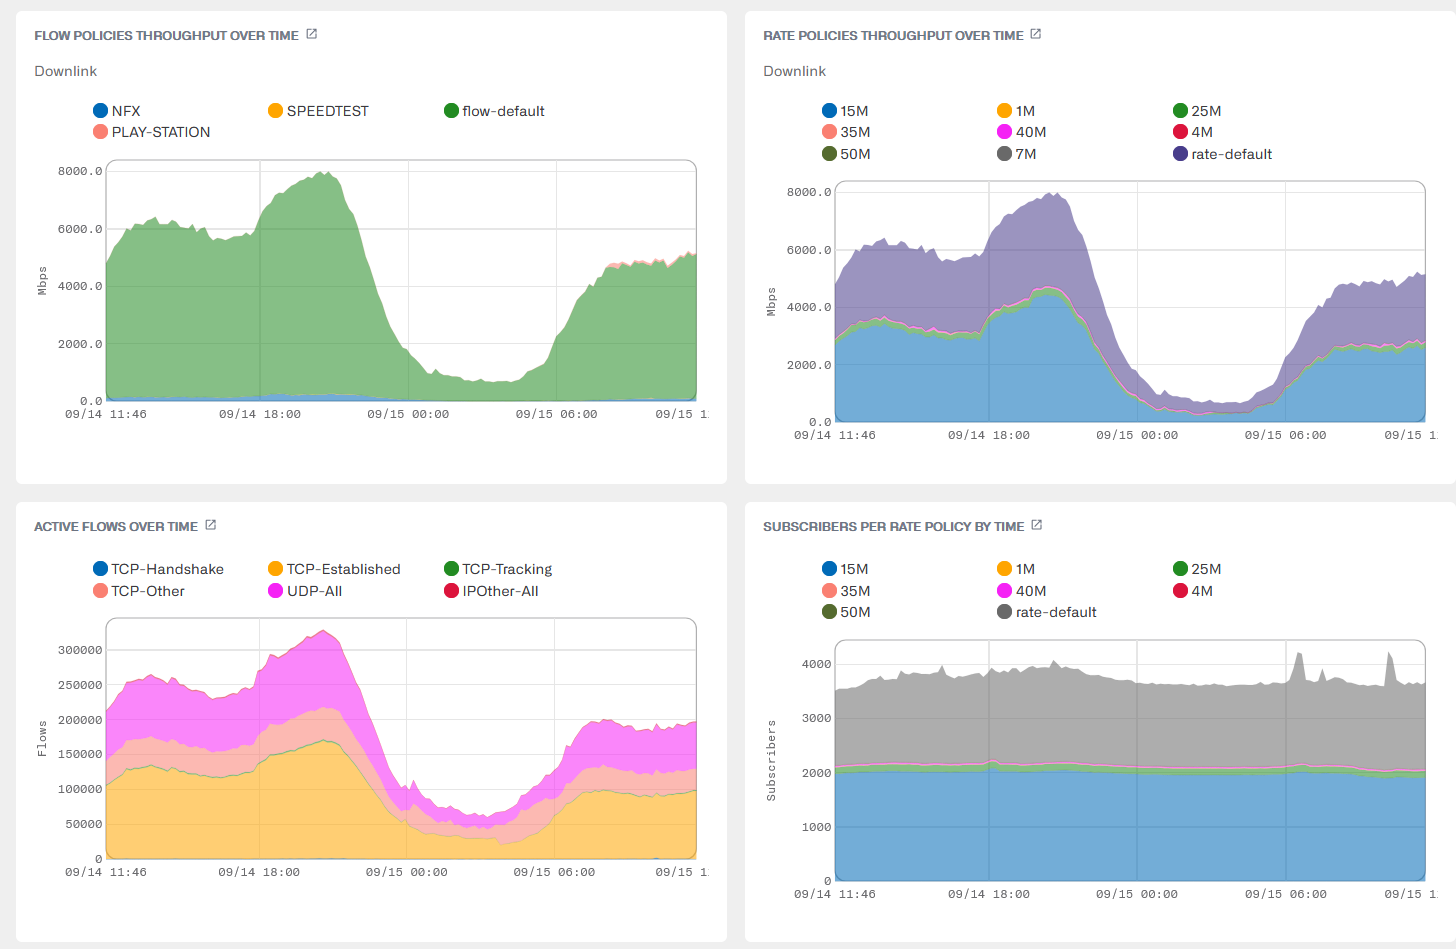
Flow Policies Throughput Over Time
Stacked chart of the downlink throughput (Mbps) of each flow policy in the whole cluster over the selected period. The policies with more traffic are named, and the rest of them are grouped into one area. Click on the colored dots of the legend to select or de-select a policy.
Click on the title to go to Statistics->Throughput->Policies (flow policies).
Rate Policies Throughput Over Time
Same as the previous chart, for the rate policies. Click on the title to go to Statistics->Throughput->Policies (rate policies).
Active Flows Over Time
Stacked chart of the number of active flows per protocol in the whole cluster over the selected period. Click on the title to go to Statistics->Flows->Per Protocol.
Subscribers per Rate Policy By Time
Stacked chart of the number of subscribers of each rate policy in the whole cluster over the selected period. The policies with more subscribers are named, and the rest of them are grouped into one area.
Click on the title to go toStatistics->Subscribers->Per Policy.
Flow Speed per Application
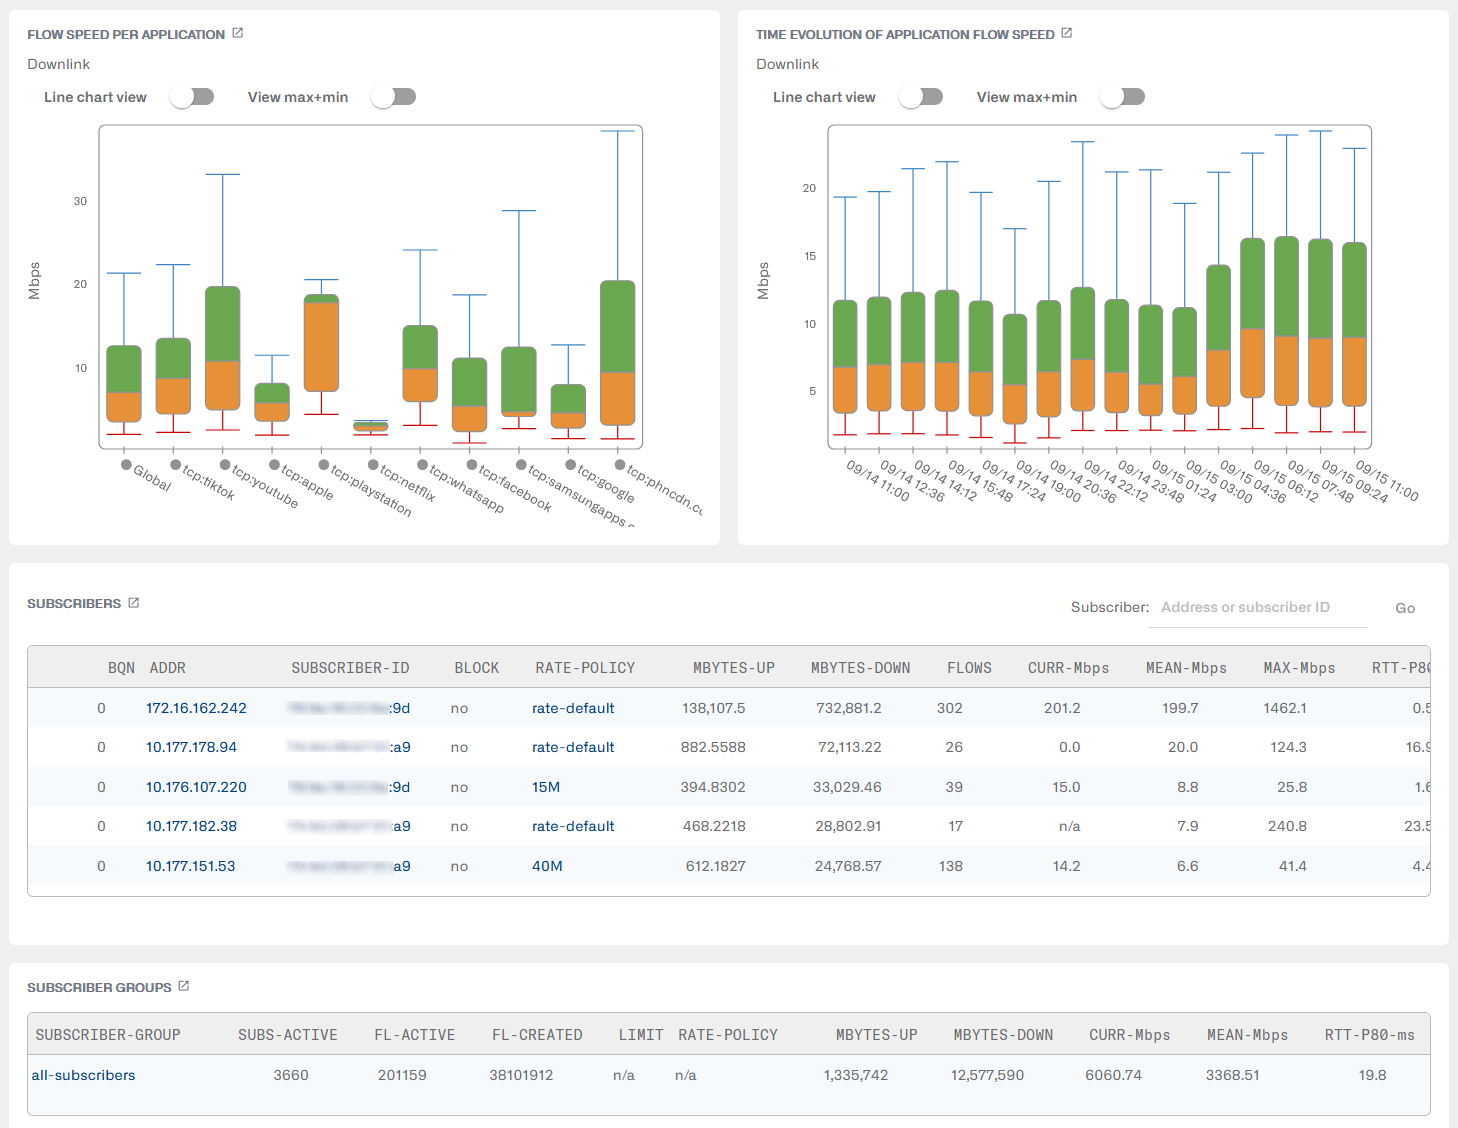
Distribution of the downlink flow speeds (Mbps) over the selected period of the applications with more traffic in the whole cluster. A box plot summarizes the speed distribution: percentiles 10, 25, 50 (akamedian), 75 and 90. The minimum and maximum values, hidden by default, can alsobe shown enabling the View max+min switch, and the Line chart view switch draws the percentiles as lines instead. Click on an application in the legend to select or de-select it.
Click on an application to see its metrics in Statistics->DPI Analysis->Application Speed Metrics, where the title leads too.
Time Evolution of Application Flow Speed
Evolution over the selected period of the distribution of the downlink flow speeds (Mbps) of all the applications together, with one box per interval of time. The switches are the same as in the previous chart.
Click on the title to go to Statistics->DPI Analysis->Application Speed Metrics.
Subscribers
The 10 active subscribers with more downlink traffic in the whole cluster. Click on the column headers to sort the table.
- Subscriber: type an IP address or a subscriber ID and press Enter (or click on Go) to open the dashboard of that subscriber.
- BQN: the BQN serving the subscriber.
- ADDR: subscriber's IP address. Click to open the subscriber dashboard.
- SUBSCRIBER-ID: subscriber ID. Click to open the subscriber dashboard.
- BLOCK: blocking from billing configuration or quota.
- RATE-POLICY: name of the subscriber'srate policy. Click to see the policy (not available to users with the rates hidden).
- MBYTES-UP, MBYTES-DOWN: total traffic volume of this subscriber in each direction since it became active.
- FLOWS: number of currently active traffic flows (TCP connections, UDP or IP flows).
- CURR-Mbps: current speed in Mbps.
- MEAN-Mbps: moving average of the mean speed (calculated every 10 minutes) in Mbps.
- MAX-Mbps: maximum speed in Mbps duringthe previous 24 hours.
- RTT-P80-ms: the 80th percentile of all RTT latency samples, measured from the BQN to the end user, in 5 minutes.
- RTT-MED-ms: the 50th percentile (median) of all RTT latency samples, measured from the BQN to the end user, in 5 minutes.
- RTT-MIN-ms: the mean of all RTT minimumlatency samples, measured in 1-second intervals, during active downloads, in 5 minutes.
- RTX: moving average of the percentage of TCP retransmissions (which reflect packet losses in this direction).
- MAX-SPEED-%: moving average of the percentage of traffic sent with a speed close to the maximum.
- CONGESTION: moving average of the percentage of traffic suffering congestion.
- WARN: number of warnings.
- LIFETIME: duration so far of this subscriber session.
Click on the title to go to Status->Subscribers->QoEMetrics.
Subscriber Groups
The 10 subscriber groups with more downlink traffic in the whole cluster. Click on the column headers to sort the table.
- SUBSCRIBER-GROUP: name of the group.Click to open the subscriber group dashboard.
- SUBS-ACTIVE: active subscribers in the group. Click to see the QoE metrics of the subscribers in the group.
- FL-ACTIVE, FL-CREATED: active flows and flows created in the group.
- LIMIT: rate limit of the group (n/a if none, or when the user has the rates hidden).
- RATE-POLICY: name of the rate policy of the group (n/a if none). A warning icon indicates that the policy is not assigned by any rule. Click to see the policy (not available to users with the rates hidden).
- MBYTES-UP, MBYTES-DOWN: total traffic volume of the group in each direction.
- CURR-Mbps, MEAN-Mbps, RTT-P80-ms, RTT-MED-ms,RTT-MIN-ms, RTX, CONGESTION, WARN, LIFETIME: as in the Subscribers table, for the whole group.
- GROUP-TYPE: type of the subscriber group.
Click on the title to go to Status->Subscribers->SubscriberGroups.
Cluster server selection in other pages
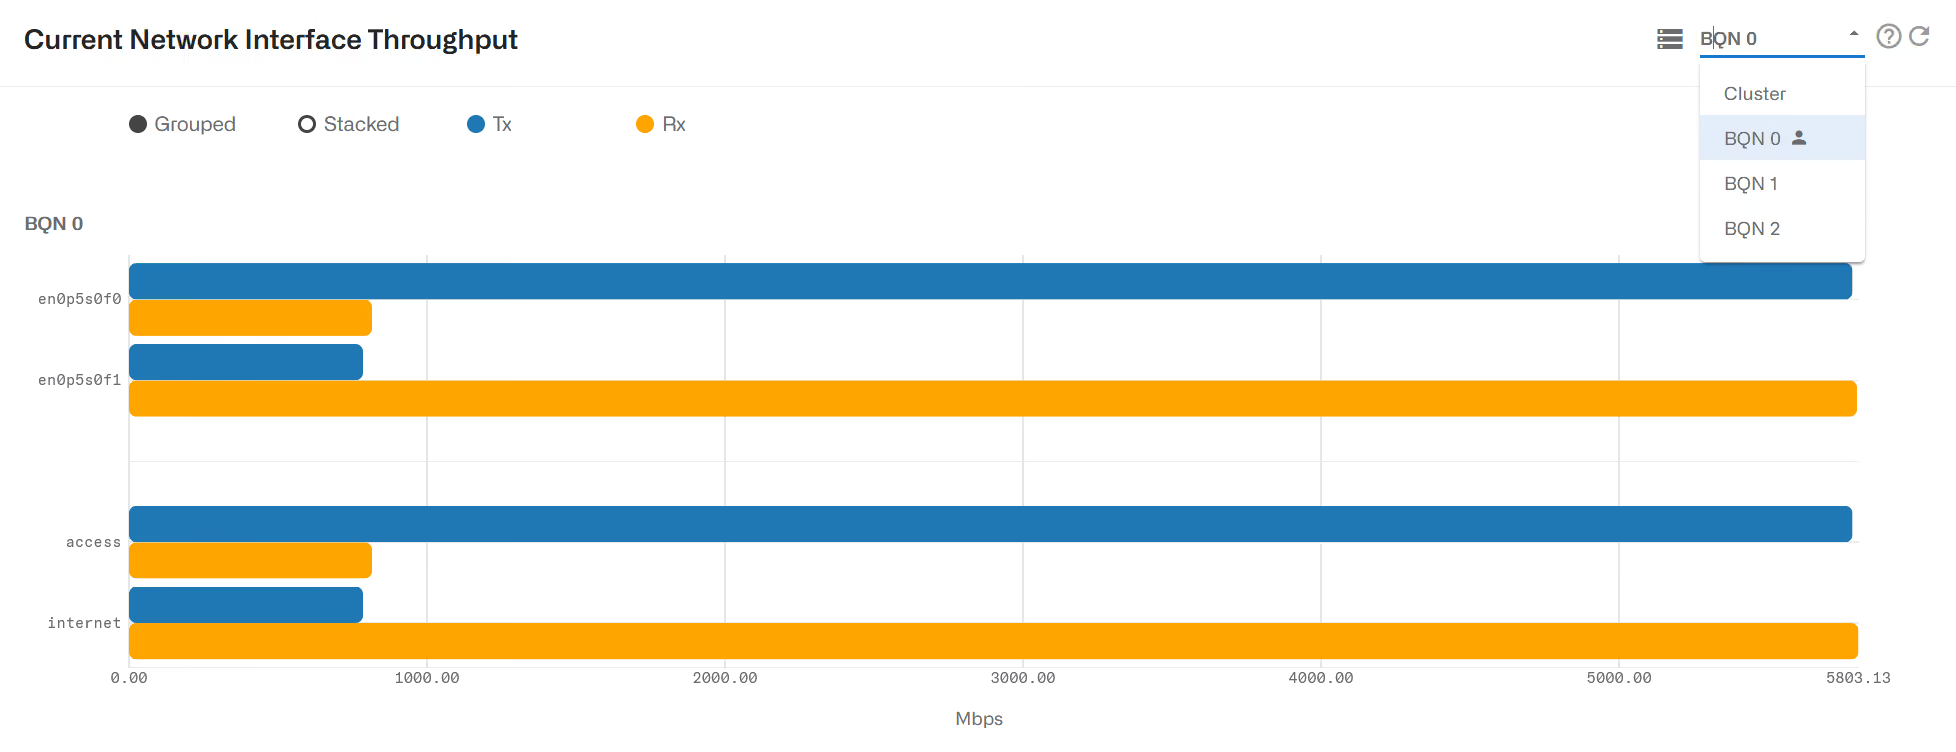
The pages can show not only information of the local server, but of any server of the cluster and for the cluster as a hole. For example, in Status->Interfaces->Throughput, a selector in the upper right can show throughput of a specific BQN Id or for all servers in the cluster (the icon next to BQN 0 indicates that we are logged in BQN 0):
In this version, the cluster does not include API aspects (integration via REST, RADIUS or billing systems), that each BQN server carries out on its own. It does not cover data plane traffic distribution either: each BQN server will receive its traffic according to an external traffic distribution (e.g. based on the place in the ISP network where each BQN server is deployed).
Cluster Deployment
The following is an example of a three-server cluster deployment:
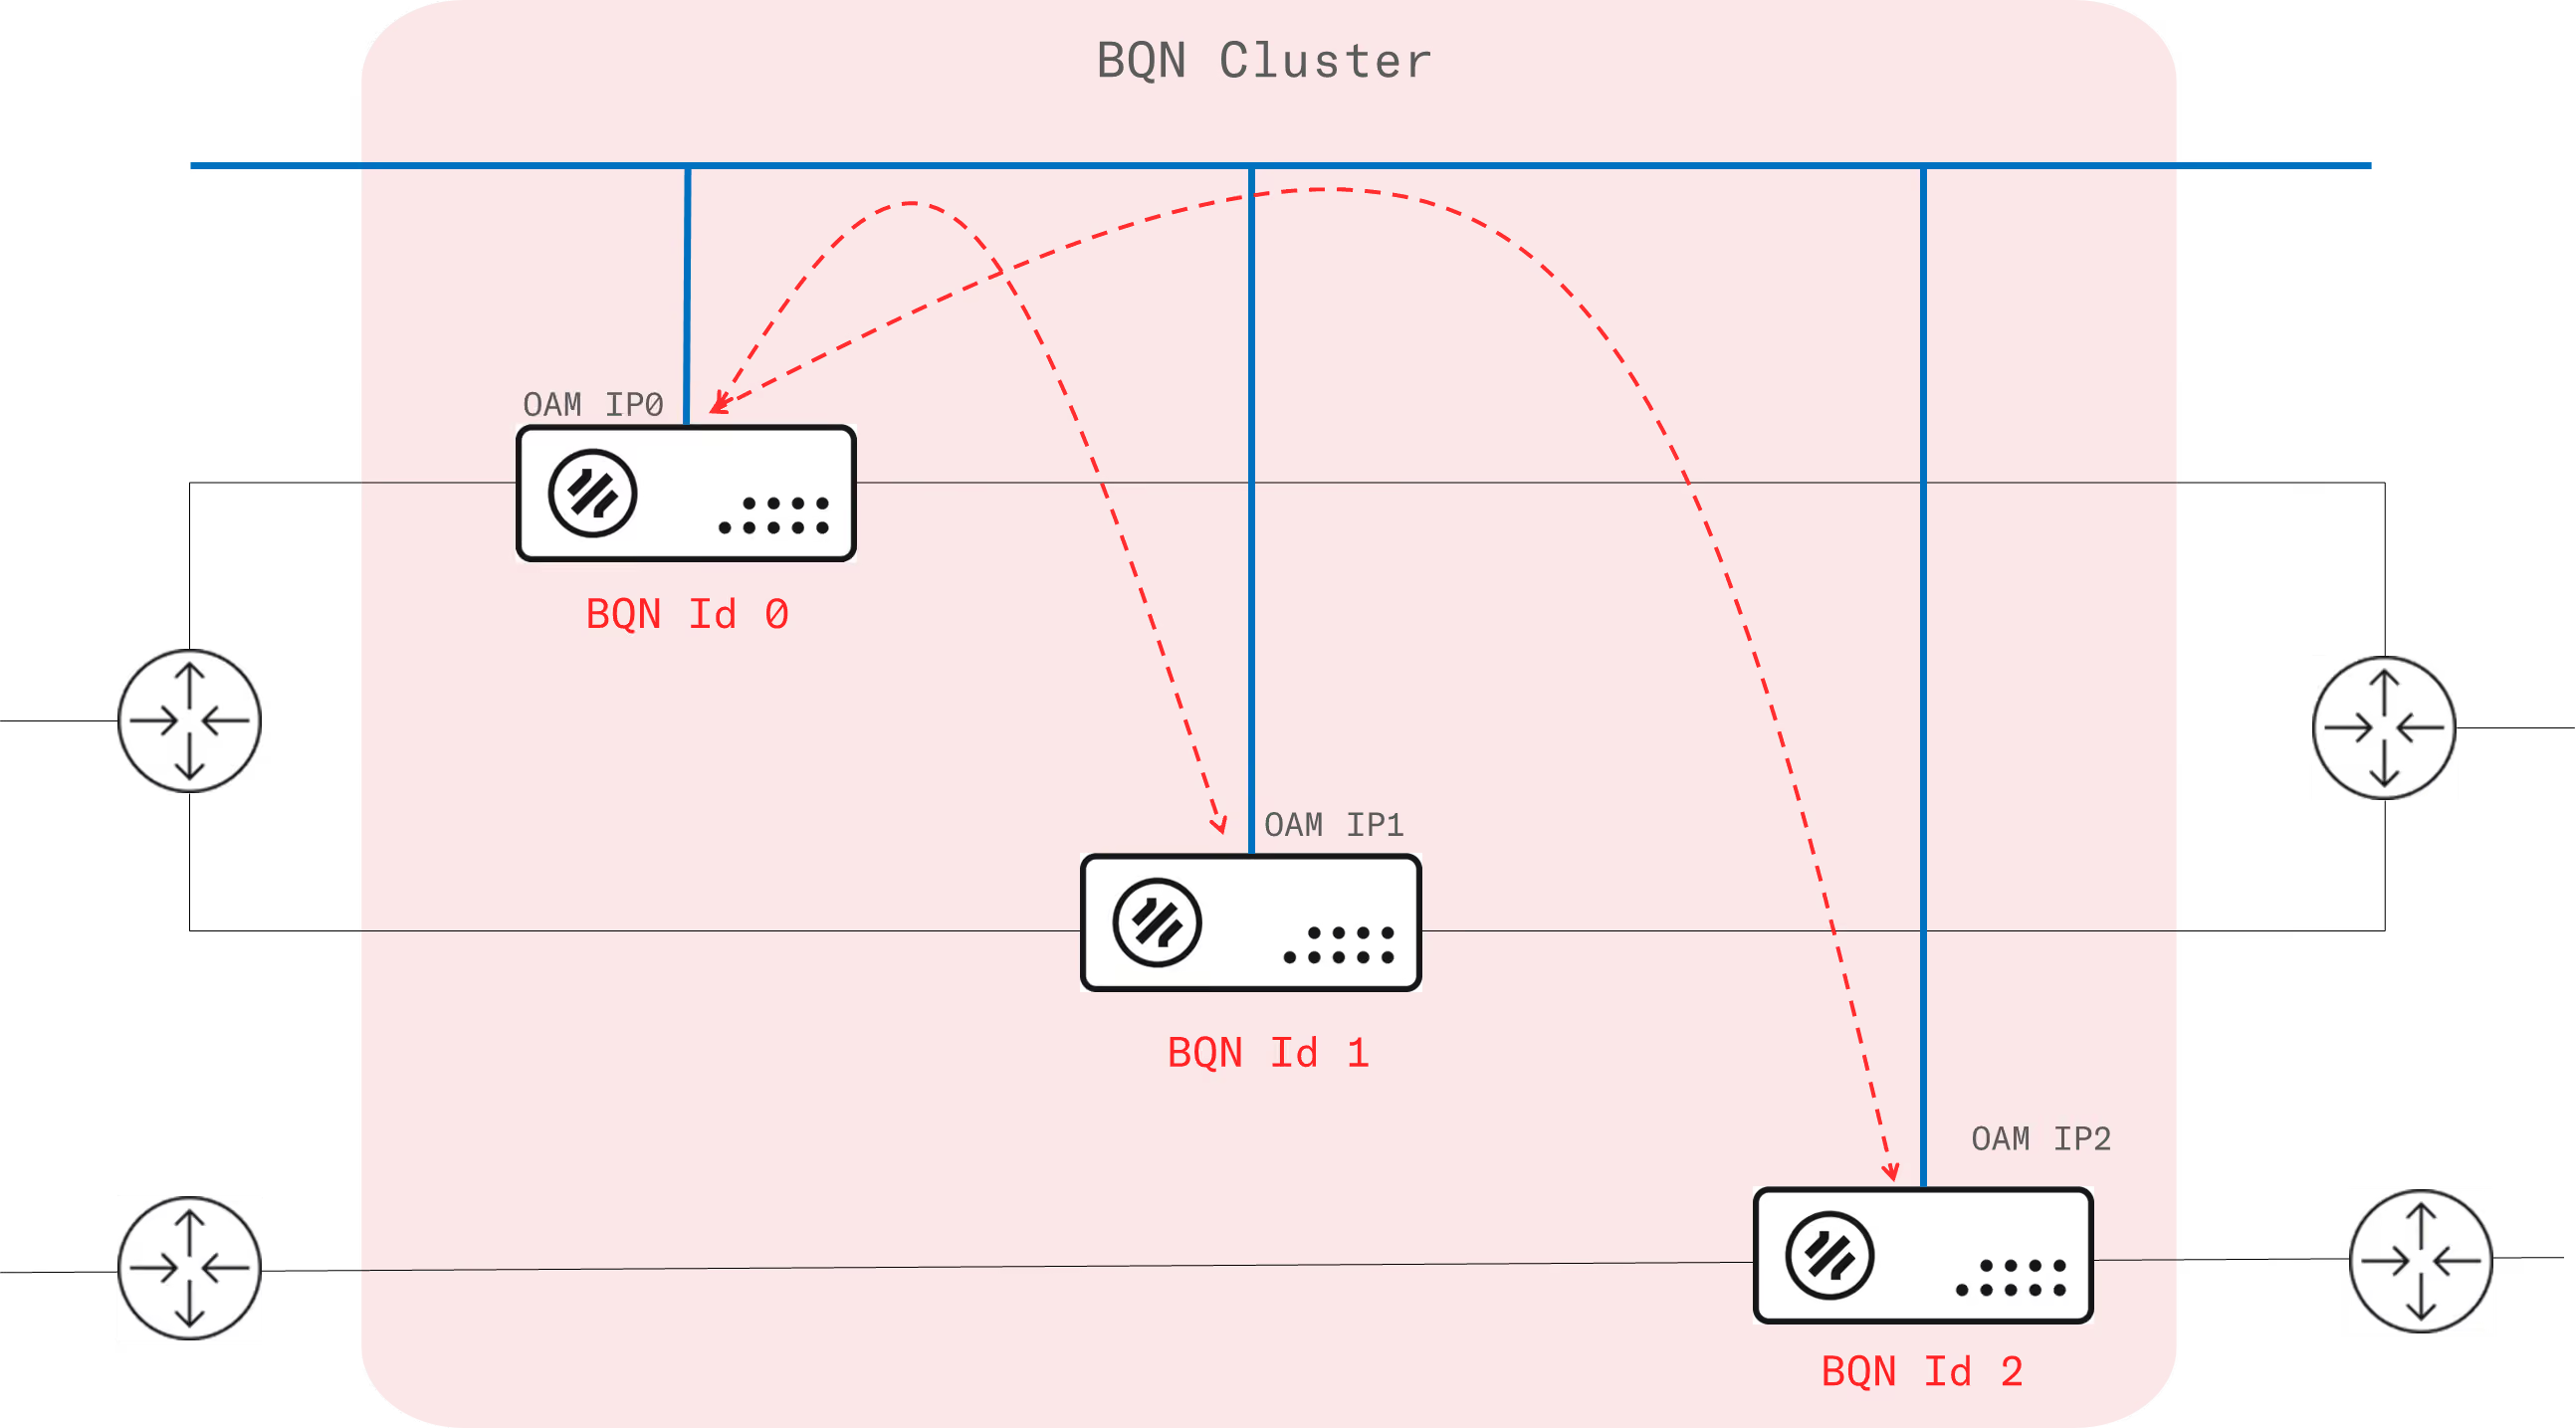
Each server in the cluster has a unique identifier, in this example, identifiers 0, 1 and 2. The server with the lowest Id (0 in this case) is the one communicating with the other servers in the cluster, it is what we call the primary server. The other two are secondary servers. The cluster is resilient: if the primary server becomes unavailable, the next with the lowest Id (1 in our example) will claim the primary role.
The communications between cluster servers use the server management IP addresses. Two types of communication exist:
- Cluster control traffic: TCP, with ports in 63501-63755 range. A BQN with an Id bigger than 0 will listen in port 63500 + Id. E.g. BQN of Id 1 will use port 63501 and BQN of Id 100 port 63600.
- Information transfers: SSH/SCP in port 22.
Every server in the cluster must have connectivity to the other servers using these ports.
To define a cluster, we need the list of Ids with the IP address and SSH port where they are reachable. This is straight forward if all the server management addresses are in the same subnet.
If there are NATs or port forwarding, this must be taken into account when setting up the cluster. In the following example, BQN are reachable through public IP addresses and their SSH port is port forwarded.
The next section describes the details to verify network connectivity and the configuration steps in order to build a cluster.
Cluster Configuration
A step-by-step procedure to create a cluster follows. We will use a simple example of cluster with a primary server with BQN ID 0 and only one secondary with ID 1.
Software Installation
All BQN servers to be part of the cluster must have the BQN software installed (R5.0 or higher), following the steps described in Software Installation section.
Setting BQN Identifiers (BQN ID)
Each BQN server will have a unique identifier. The BQN with the lowest ID will act as primary server.
Our recommendation is to start from ID 0 and continue with 1, 2, etc.
By default, a BQN server has ID 0, so the one to be the primary will not need a change of ID. For the other servers, follow this procedure:
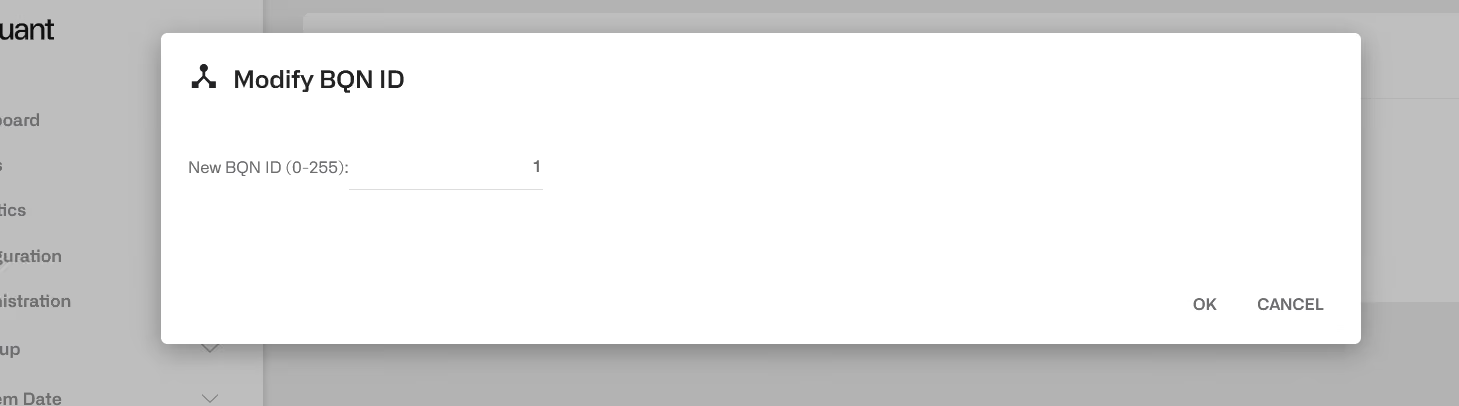
- Go to Administration->Cluster and click on Modify BQN ID.
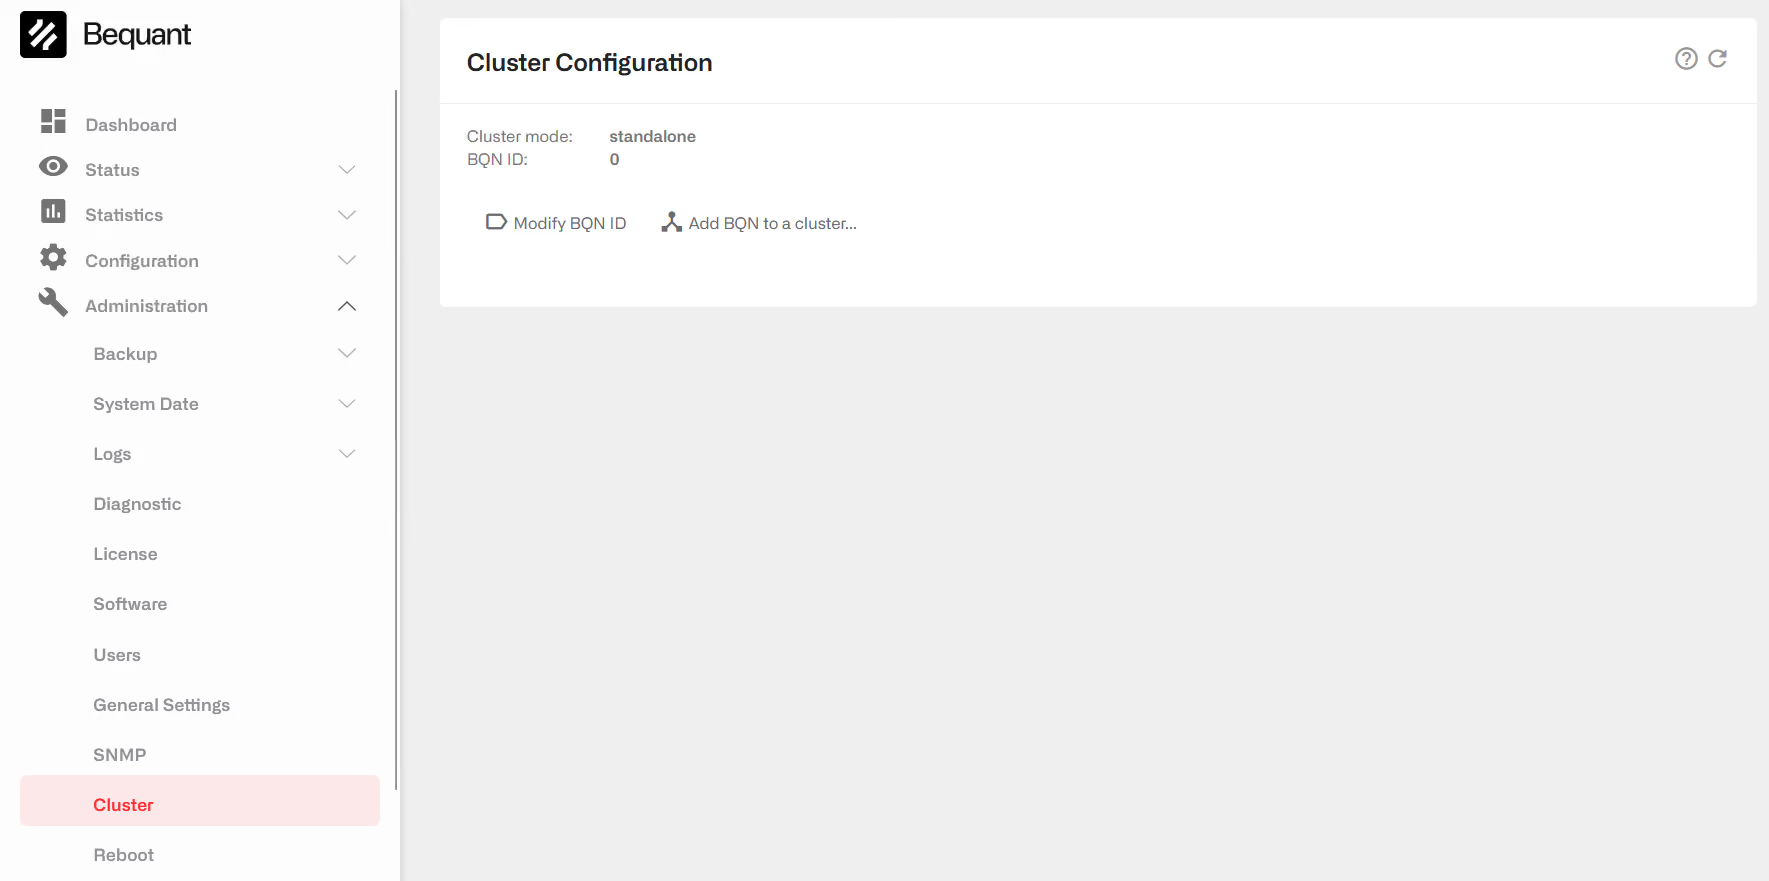
- Enter the new BQN ID value, between 0 and 255 (e.g. 1). The change reloads the software, so, if the BQN is processing traffic, it causes an interruption of service. The GUI will log you out. Log in again to continue.
OAM IP addresses connectivity
The BQN management IP addresses must be reachable from each other. So, for example, for two BQNs with IP addresses 192.168.56.111 and 192.168.56.112, we access both servers to check their mutual connectivity:
The cluster uses the TCP port range between 63501 and 63755.
Each server, other than BQN ID 0, listens on a port whose number depends on the BQN identifier. For example, BQN ID 1 will listen on port 63501. The port must be accessible from servers with a lower BQN ID. For example, BQN ID 0 must access port 63501 in BQN ID 1. If a new server with ID 2 is added to the cluster, both BQN IDs 0 and 1 will need to access port 63502 in BQN ID 2.
To check that those ports are open, generate TCP traffic to each BQN address and port with telnet and check that it is received using tcpdump on the destination. For example, to check bqn0 can send TCP to bqn1, we need to check on port 63501 (the port a bqn with ID 1 is listening to). Start tcpdump on destination:
Generate traffic to port using telnet (it is expected to be rejected, no listening when the cluster is not yet configured):
while on destination, the traffic is received:
For the other ports, if any, check that they are accessible from servers with a lower BQN ID following the previous procedure.
SSH is also used. To check ssh from bqn0 to bqn1.
And likewise from bqn1 to bqn0:
If a third server is to be added to the cluster, the connectivity between this server and the other two must be checked as previously described.
Sometimes, a BQN OAM IP address is reachable through a public IP address that is mapped to the BQN actual IP. In that case, you need to add the cluster ports to the mapping (e.g. 63501-63502). When verifying connectivity, use the public IP address to reach that BQN server.
Unify configuration across the cluster
If the cluster will be built with BQNs previously in use as standalone, you need to check their configurations to spot differences and settle on a common one. If there are differences and no unification is done, the configuration of the primary server will be used as configuration of the cluster.
The following example shows a typical procedure. We will have two servers to add to cluster. We will modify bqn0 configuration to serve as a unified version of both servers.
- Go to the primary server Administration->Backup->SaveConfiguration and save configuration (e.g. bqn0-v1.conf).
- Do the same in the secondary server Administration->Backup->SaveConfiguration and save configuration (e.g. bqn1-v1.conf).
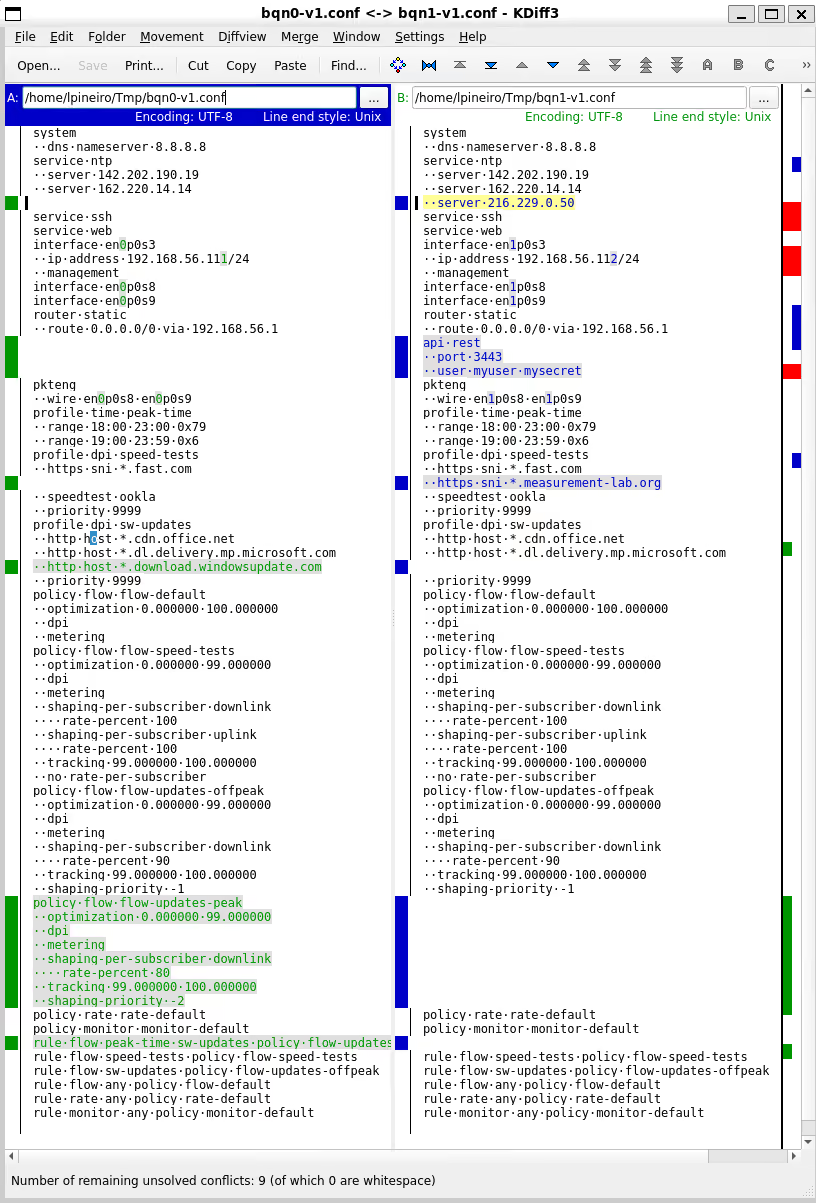
- Compare both files. For example, using kdiff3 tool, we find the following differences:
- NTP server 216.229.0.50 is missing in bqn0. We will add it.
- bqn0 has no REST API enabled. We add it.
- Interface differences are OK, they are server specific, so we take no action. Routing is also server specific (it is the same in this example, but if it were different, they would not be merged).
- In speed-tests profile, bqn1 has an extra entry, we add it to bqn0.
- In sw-updates, bqn0 has an extra entry, add it to bqn1.
- bqn0 has an extra rule for sw updates during peak time, add it to bqn1.
After the previous steps, we should have a bqn0-v2.conf and bqn1-v2.conf with the merged configuration.
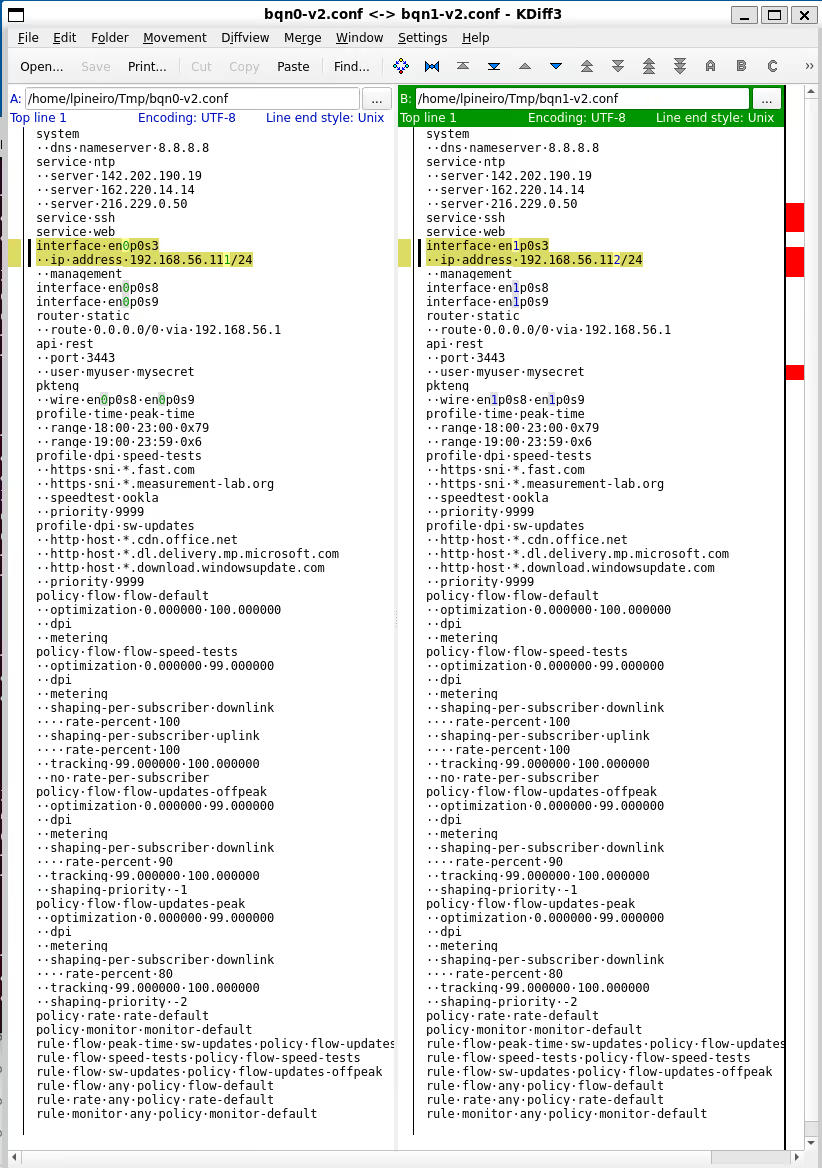
You can repeat the procedure for other BQN servers to be added to the cluster.
Go to primary server Administration->Backup->Load Configuration and load bqn0-v2.conf.
The secondaries will automatically get this unified configuration as soon as the cluster is set up.
Configuring the Cluster
We will start the creation of the cluster by configuring in the primary server. Go to the primary server GUI and select Administration->Cluster and click on Add BQN to a cluster...
In the dialogue, enter the secondary BQN ID (1) and its BQN management IP address. In IP Address for this BQN in cluster, enter the primary address.
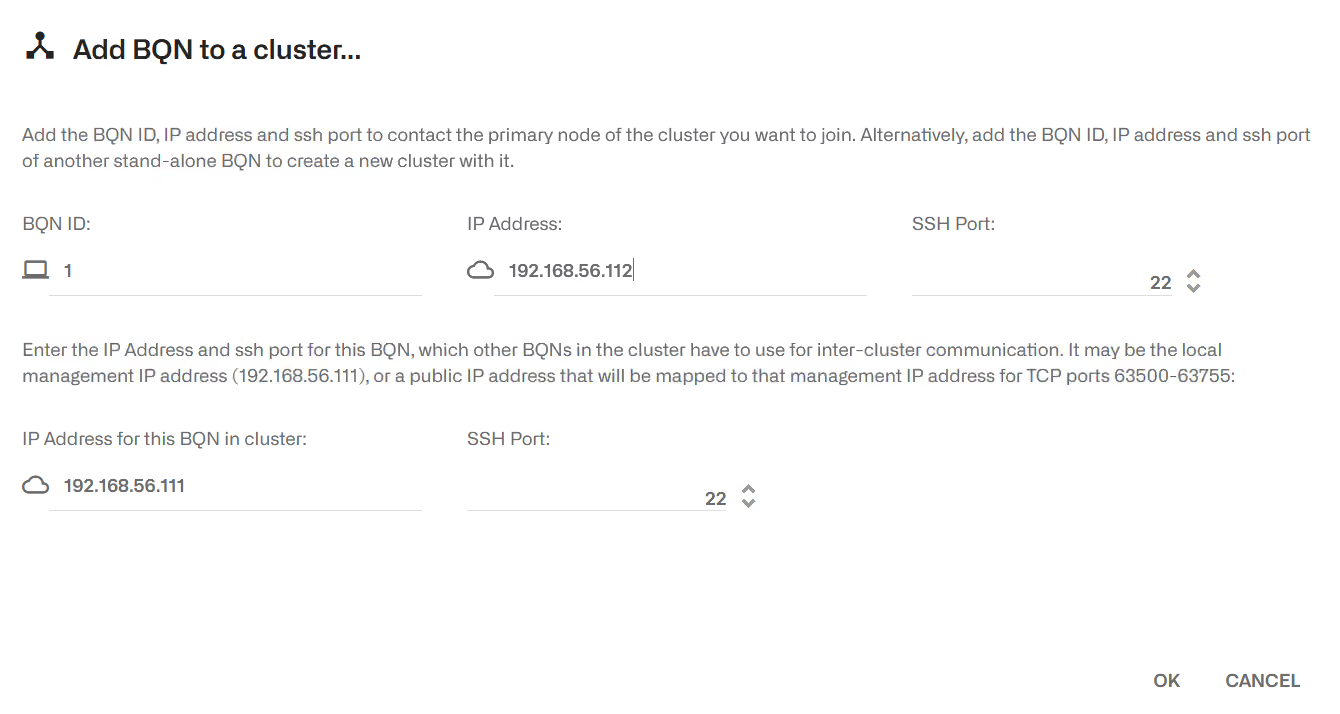
In this example, we use the management IP addresses 192.168.56.111 and 192.168.56.112. If the servers are accessible via public IP addresses, use them instead.
The same procedure is followed in the secondary BQN server: go to the secondary GUI and select Administration->Cluster and click on Add BQN to a cluster...
In the dialogue, enter the primary BQN ID (0) and the primary BQN IP address. In the IP Address for this BQN in cluster field, enter the IP address of the secondary server.
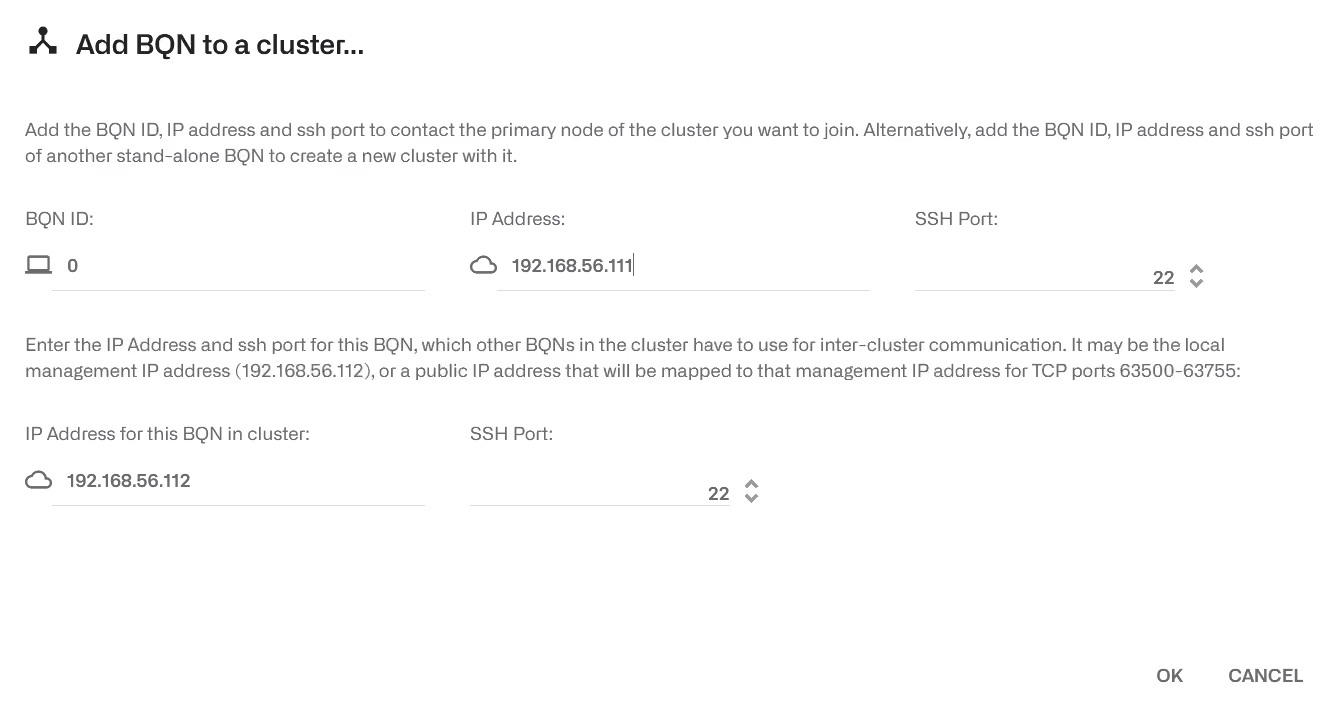
The IPs can be the management addresses, like in this example, but if any of the servers is accessible through a public IP address, use that address instead.
The cluster should show a state ready and a status complete:
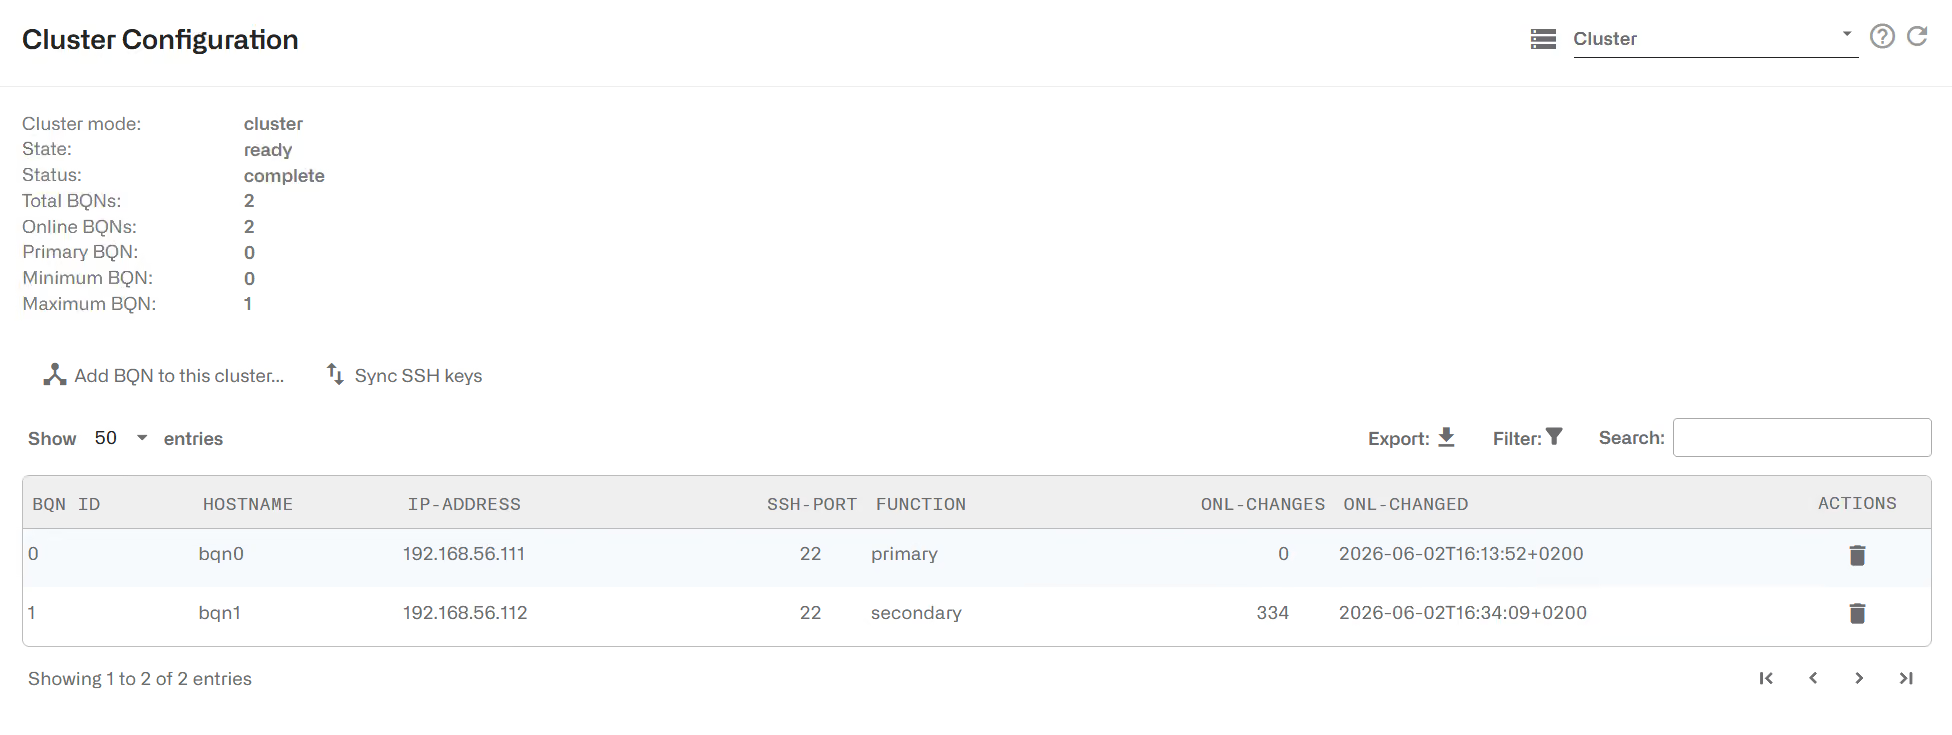
You can repeat the process to add more servers to the cluster by going to that server GUI and clicking on Add BQN to a cluster.
Once all the server has been added to the cluster and the cluster status is complete, go to all servers in the cluster and click on Sync SSH keys, to enable direct connection among them.
Lorem ipsum dolor sit amet, consectetur adipiscing elit. Suspendisse varius enim in eros elementum tristique. Duis cursus, mi quis viverra ornare, eros dolor interdum nulla, ut commodo diam libero vitae erat. Aenean faucibus nibh et justo cursus id rutrum lorem imperdiet. Nunc ut sem vitae risus tristique posuere.
Lorem ipsum dolor sit amet, consectetur adipiscing elit. Suspendisse varius enim in eros elementum tristique. Duis cursus, mi quis viverra ornare, eros dolor interdum nulla, ut commodo diam libero vitae erat. Aenean faucibus nibh et justo cursus id rutrum lorem imperdiet. Nunc ut sem vitae risus tristique posuere.
Lorem ipsum dolor sit amet, consectetur adipiscing elit. Suspendisse varius enim in eros elementum tristique. Duis cursus, mi quis viverra ornare, eros dolor interdum nulla, ut commodo diam libero vitae erat. Aenean faucibus nibh et justo cursus id rutrum lorem imperdiet. Nunc ut sem vitae risus tristique posuere.